I was onto our next book – Linear,Ridge, LAASO, and Elastic Net Algorithm explained in layman terms with code in R , when we thought of covering the simple concepts which are quite helpful while creating models.
Cross Validation is one simple concept which definitely improves the performance of your model. A lot of you must be using this to create a k-fold cross validation
Let’s quickly go through this relatively simple concept and there is no better way than starting with code
cv <- trainControl(method="repeatedcv",
number=10,
repeats = 5,
verboseIter = T
)
Here we are creating a variable which holds a property i.e. whenever this variable ‘cv’ is called, it will ask the model definition to divide the dataset in 10 equal parts and train the model on 9 parts while testing on the last one i.e. Train on N-1 data points
repeats = 5 means the above process will repeat 5 times i.e. this 9-1 split train and test is done 5 times.
What would you do with this regressive training?
We will compute different Root Mean Square Error, R Square and Mean Absolute Error, and will then decide the best model.
And this is how we use it in a Ridge model
ridge <- train(medv~.,
              BD,
              method = 'glmnet',
              tuneGrid=expand.grid(alpha=0,lambda=seq(0.0001,1,length=10)),
              trControl=cv
              )
So, here we are creating a Ridge Regression model, predicting the value of medv on the dataset BD and the package/function is glmnet, the tuning parameter tells the model that it’s a ridge model(alpha=0) and a total of 10 numbers ranging from 0.0001 and 1 (Equally spaced)
After all this we specify the model to use the cross validation with trControl parameter
The next function which I love while creating models is varImp. This is a simple function which finds out the most important variables in a set of variables. I think it’s a part of the caret package(do check)
varImp(Lasso, scale = F)
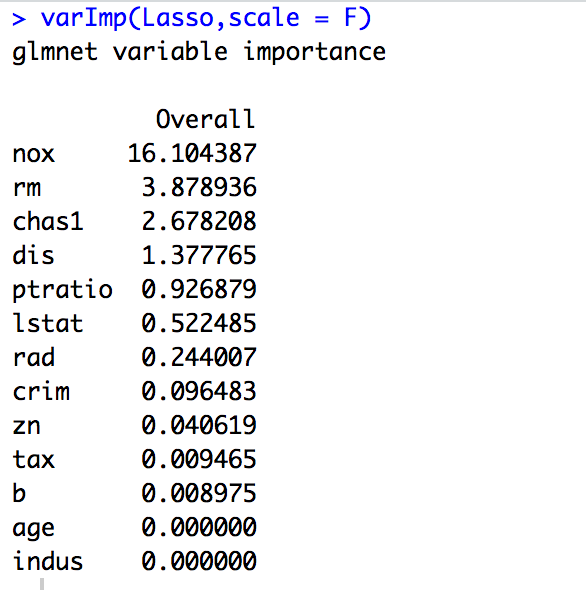
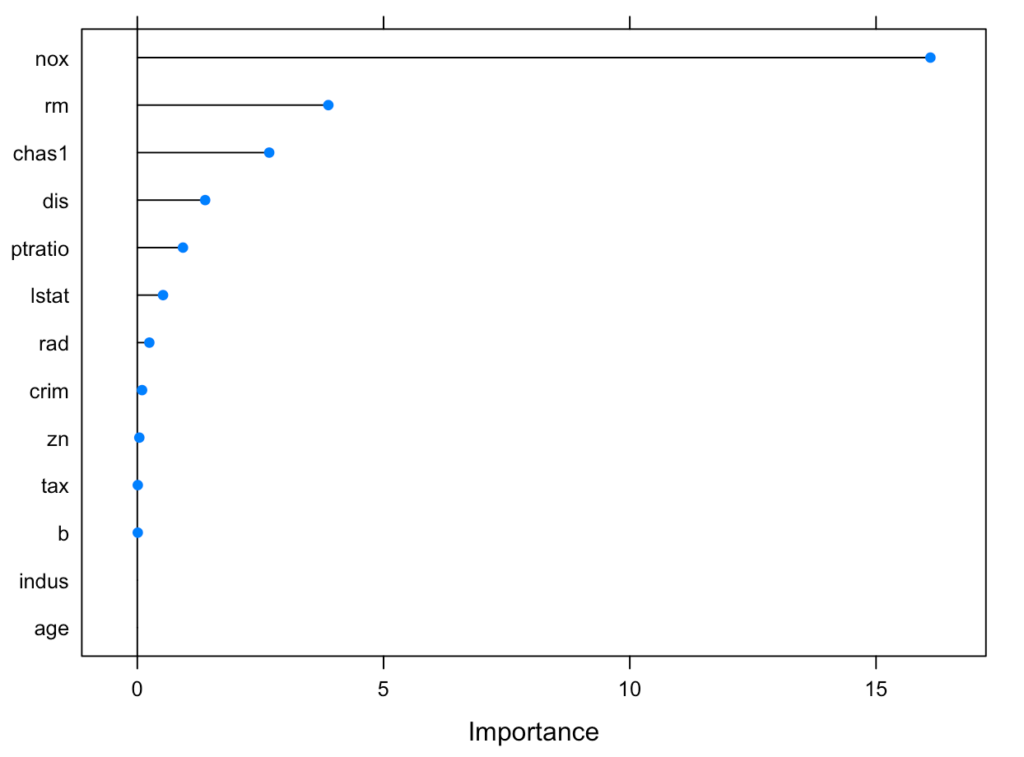
Here we have at least 3 and at max 4 important variables to consider in the model. You can also plot the same using the below function
plot(varImp(Lasso,scale=F)
Just a short article covering a couple of concepts.
Keep Learning 🙂
The Data Monk
The Data Monk services
We are well known for our interview books and have 70+ e-book across Amazon and The Data Monk e-shop page . Following are best-seller combo packs and services that we are providing as of now
- YouTube channel covering all the interview-related important topics in SQL, Python, MS Excel, Machine Learning Algorithm, Statistics, and Direct Interview Questions
Link – The Data Monk Youtube Channel - Website – ~2000 completed solved Interview questions in SQL, Python, ML, and Case Study
Link – The Data Monk website - E-book shop – We have 70+ e-books available on our website and 3 bundles covering 2000+ solved interview questions. Do check it out
Link – The Data E-shop Page - Instagram Page – It covers only Most asked Questions and concepts (100+ posts). We have 100+ most asked interview topics explained in simple terms
Link – The Data Monk Instagram page - Mock Interviews/Career Guidance/Mentorship/Resume Making
Book a slot on Top Mate
The Data Monk e-books
We know that each domain requires a different type of preparation, so we have divided our books in the same way:
1. 2200 Interview Questions to become Full Stack Analytics Professional – 2200 Most Asked Interview Questions
2.Data Scientist and Machine Learning Engineer -> 23 e-books covering all the ML Algorithms Interview Questions
3. 30 Days Analytics Course – Most Asked Interview Questions from 30 crucial topics
You can check out all the other e-books on our e-shop page – Do not miss it
For any information related to courses or e-books, please send an email to nitinkamal132@gmail.com