We know that each domain requires a different type of preparation, so we have divided our books in the same way:
Our best seller:
✅Become a Full Stack Analytics Professional with The Data Monk’s master e-book with 2200+ interview questions covering 23 topics – 2200 Most Asked Interview Questions
Machine Learning e-book
✅Data Scientist and Machine Learning Engineer ->23 e-books covering all the ML Algorithms Interview Questions
Domain wise interview e-books
✅Data Analyst and Product Analyst Interview Preparation ->1100+ Most Asked Interview Questions
✅Business Analyst Interview Preparation ->1250+ Most Asked Interview Questions
The Data Monk – 30 Days Mentorship program
We are a group of 30+ people with ~8 years of Analytics experience in product-based companies. We take interviews on a daily basis for our organization and we very well know what is asked in the interviews.
Other skill enhancer websites charge 2lakh+ GST for courses ranging from 10 to 15 months.
We only focus on making you a clear interview with ease. We have released our Become a Full Stack Analytics Professional for anyone in 2nd year of graduation to 8-10 YOE. This book contains 23 topics and each topic is divided into 50/100/200/250 questions and answers. Pick the book and read it thrice, learn it, and appear in the interview.
We also have a complete Analytics interview package
– 2200 questions ebook (Rs.1999) + 23 ebook bundle for Data Science and Analyst role (Rs.1999)
– 4 one-hour mock interviews, every Saturday (top mate – Rs.1000 per interview)
– 4 career guidance sessions, 30 mins each on every Sunday (top mate – Rs.500 per session)
– Resume review and improvement (Top mate – Rs.500 per review)
YouTube channel covering all the interview-related important topics in SQL, Python, MS Excel, Machine Learning Algorithm, Statistics, and Direct Interview Questions
Link –The Data Monk Youtube Channel
Lowe’s Data Science Interview Questions
Company: Lowe’s Companies, Inc.
Designation: Data Scientist
Year of Experience Required: 0 to 4 years
Technical Expertise: SQL, Python/R, Statistics, Machine Learning, Case Studies
Salary Range: 12LPA – 30LPA
Lowe’s Companies, Inc., headquartered in Mooresville, North Carolina, is a leading American retail company specializing in home improvement. With a vast network of stores across the United States, Canada, and Mexico, Lowe’s is a trusted name in the home improvement industry. If you’re preparing for a Data Science role at Lowe’s, here’s a detailed breakdown of their interview process and the types of questions you can expect.
Lowe’s Data Science Interview Questions

We bring some of the questions asked in a Lowe’s Data Analyst interview. They will give you insight of the selection procedure.
Interview Process
The Lowe’s Data Science interview process typically consists of 5 rounds, each designed to evaluate different aspects of your technical and analytical skills:
Round 1 – Telephonic Screening
Focus: Basic understanding of Data Science concepts, SQL, and Python/R.
Format: You’ll be asked to explain your projects and solve a few coding or SQL problems.
Round 2 – Walk-in/Face-to-Face Technical Round
Focus: Advanced SQL, coding, and problem-solving.
Format: You’ll solve problems on a whiteboard or shared document.
Round 3 – Project Analysis
Focus: Deep dive into your past projects.
Format: You’ll be asked to explain your approach, tools used, and the impact of your work.
Round 4 – Case Studies
Focus: Business problem-solving and data-driven decision-making.
Format: You’ll be given a real-world scenario and asked to propose solutions.
Round 5 – Hiring Manager Round
Focus: Cultural fit, communication skills, and long-term career goals.
Format: Behavioral questions and high-level discussions about your experience.
Difficulty of Questions
SQL – 8/10
1) How can you retrieve the latest order placed by each customer?
SELECT customer_id, MAX(order_date) AS latest_order_date
FROM orders
GROUP BY customer_id;
2) How do you find employees who joined the company in the last three months?
SELECT *
FROM employees
WHERE joining_date >= DATE_SUB(CURDATE(), INTERVAL 3 MONTH);
3) How can you identify duplicate records in a table based on an email column?
SELECT email, COUNT(*) AS count
FROM customers
GROUP BY email
HAVING count > 1;
4) How can you find the second-lowest salary from the employees table?
SELECT DISTINCT salary
FROM employees
ORDER BY salary ASC
LIMIT 1 OFFSET 1;
5) How can you calculate the total revenue generated for each product?
SELECT product_id, SUM(price * quantity) AS total_revenue
FROM order_details
GROUP BY product_id
ORDER BY total_revenue DESC;
R/Python – 7/10
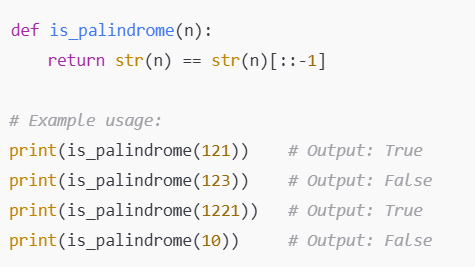
1) Write a Python function to check if a given integer is a palindrome. A number is a palindrome if it remains the same when reversed.
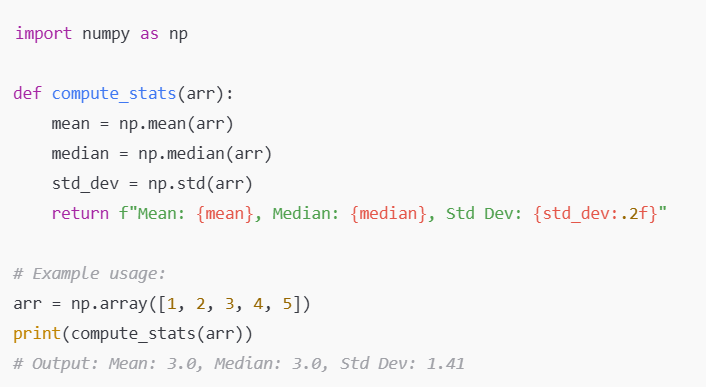
2) Write a Python function using NumPy to compute the mean, median, and standard deviation of a given array.
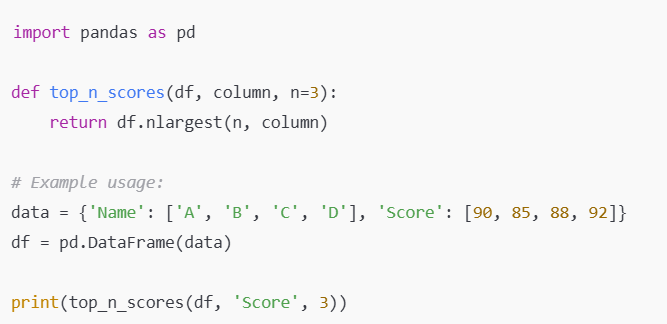
3) Write a Python function using Pandas to find the top N highest values in a given column of a DataFrame.
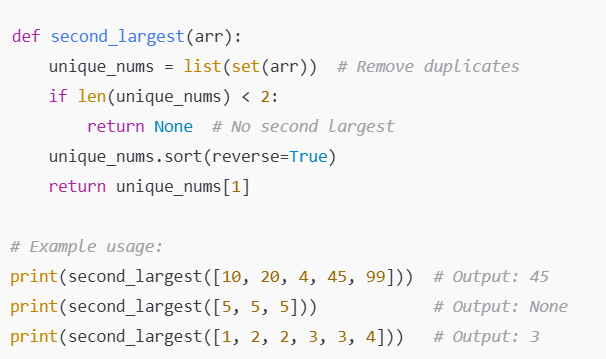
4) Write a Python function to find the second largest number in a given list. If there is no second largest, return None.
5) Write a Python function to detect if a linked list contains a cycle using Floyd’s Tortoise and Hare algorithm.

Statistics/ML – 9/10
1) Derive the expectation for a geometric distributed random variable. What is the use of it?
A geometric distribution models the number of trials before the first success in a sequence of independent Bernoulli trials, where each trial has a success probability p.
The expectation E(X) for a geometric distribution is derived as:
E(X) = Σ (from k=1 to ∞) k * p * (1-p)^(k-1)
Using the sum formula for geometric series, we get:
E(X) = 1/p
Use of Geometric Distribution:
- Failure Rate Analysis: Predicting the number of failures before the first success in a system.
- Queueing Systems: Estimating waiting times.
- Marketing & Sales: Estimating how many calls are needed before a customer makes a purchase.
2) How would you build and test a metric to compare two user’s ranked lists of movie/TV show preferences?
Since the users’ preferences are ranked, a good metric to compare them is Kendall’s Tau or Spearman’s Rank Correlation.
Steps to Build the Metric:
- Collect Data: Get the ranked lists from both users.
- Use Kendall’s Tau: This measures how similar the rankings are by counting the number of agreements and disagreements in order.
- Normalize the Score: Convert it to a scale of -1 (opposite ranking) to +1 (identical ranking).
- Test the Metric:
- Generate sample rankings and check correlation values.
- Compare results with manually analyzed lists to validate accuracy.
Kendall’s Tau is useful as it works well even if the lists have different lengths.
3) Can you choose a strategy for increasing the number of songs listened by users on an online application? How will you decide the types of playlists to suggest?
Strategy to Increase Songs Listened:
- Personalized Recommendations: Use machine learning (collaborative filtering) to suggest songs based on user behavior.
- Autoplay & Smart Playlists: Enable continuous play with AI-curated playlists.
- Gamification: Reward users for listening to new songs.
- Dynamic UI Suggestions: Highlight playlists based on mood, trends, or time of day.
Choosing Playlists to Suggest:
- Past Listening History: Suggest genres similar to what the user listens to.
- Trending & New Releases: Mix popular and fresh music.
- User-Generated Playlists: Show playlists from similar users.
This strategy ensures users stay engaged and discover new music.
4) How can we make sure that K-Means output is not sensitive to initialization?
K-Means clustering is sensitive to the initial centroids. To make it more stable:
- Use K-Means++: This algorithm selects better initial centroids to reduce variability.
- Run Multiple Times: Execute K-Means multiple times with different seeds and take the best clustering result.
- Increase Iterations: Allow more iterations so clusters can converge properly.
- Normalize Data: Scaling features reduces the impact of outliers on centroid selection.
By applying these techniques, we get more reliable clustering results.
5) You are given a data set. The data set has missing values which spread along 1 standard deviation from the median. What percentage of data would remain unaffected? Why?
In a normal distribution, about 68% of the data lies within 1 standard deviation from the mean (or median). Therefore, the missing values affect 68% of the data, and 32% of the data remains unaffected.
Case Study
Problem Statement:
Lowe’s wants to improve its demand forecasting model to ensure the right products are available at the right time while minimizing excess inventory. As a Data Scientist, your task is to analyze historical sales data, seasonal trends, and supply chain factors to optimize inventory levels across different store locations.
Dataset Overview:
You have access to a dataset containing historical sales and inventory data for Lowe’s products across multiple stores. The dataset includes:
- Product_ID – Unique identifier for each product
- Store_ID – Unique identifier for each Lowe’s store
- Category – Product category (e.g., tools, appliances, furniture)
- Sales_Quantity – Number of units sold per day/week
- Price – Selling price of the product
- Stock_Level – Current inventory available in each store
- Supplier_Lead_Time – Average time taken by suppliers to restock the product
- Seasonality_Flag – Indicator of whether the product has seasonal demand
- Customer_Demand_Trend – Historical trend of demand fluctuations
- Promotions_Discounts – Information on past promotional campaigns and their impact on sales
Key Questions to Answer:
1. What factors impact product demand at Lowe’s?
- How do seasonal trends affect sales for different product categories?
- Do pricing and promotions significantly influence demand fluctuations?
- How does regional customer behavior impact inventory needs across stores?
2. How can Lowe’s optimize inventory levels across stores?
- Can Lowe’s use predictive analytics to improve inventory planning?
- Should Lowe’s implement automated restocking models based on demand forecasts?
- How can Lowe’s balance reducing excess stock while preventing stockouts?
3. How can Lowe’s improve demand forecasting accuracy?
- Should Lowe’s integrate weather data, economic indicators, and competitor pricing into its models?
- How can AI and machine learning enhance Lowe’s forecasting methods?
- What strategies can Lowe’s use to handle sudden demand spikes (e.g., during natural disasters)?
Key Insights & Business Recommendations
1. Understanding Demand Patterns
- Seasonal Demand Trends: Products like grills and patio furniture see high demand in summer, while heaters and insulation materials peak in winter. Lowe’s should adjust inventory accordingly.
- Price Sensitivity & Promotions: Sales data shows that discounts on power tools and home appliances lead to short-term sales spikes, requiring better stock planning.
- Regional Variability: Stores in hurricane-prone areas experience increased demand for generators and emergency supplies, requiring location-specific inventory strategies.
2. Optimizing Inventory Management
- AI-Based Restocking Models: Lowe’s can implement machine learning models to predict demand at each store and automate inventory replenishment to prevent overstocking or stockouts.
- Dynamic Safety Stock Levels: Instead of a fixed inventory threshold, Lowe’s should adjust safety stock based on real-time sales velocity and supplier lead times.
- Supply Chain Optimization: By identifying fast-moving products, Lowe’s can negotiate better supplier contracts for quicker restocking and reduced lead times.
3. Improving Forecasting Accuracy
- Incorporating External Data Sources: Lowe’s should integrate weather forecasts, local economic conditions, and housing market trends to refine demand predictions.
- AI-Powered Demand Prediction: Using deep learning techniques, Lowe’s can enhance forecasting accuracy for new product launches and changing consumer trends.
- Real-Time Inventory Tracking: Implementing IoT sensors in warehouses and stores can help track stock levels and prevent inventory mismatches.