Topic – Pandas Interview Questions
What are the important features of Pandas due to which it is used widely in the Analytics domain?
Pandas is a widely used Python library for data manipulation and analysis. It offers data structures and operations for manipulating numerical tables and time series. Some of the important features of Pandas include:
- Data Structures: Pandas provides two main data structures, Series and DataFrame, which are powerful for handling and manipulating data effectively.
- Data Alignment and Handling Missing Data: Pandas allows easy alignment of data, making it simple to work with incomplete data, with methods for handling missing data like
dropnaandfillna. - Flexible Data Manipulation: Pandas enables flexible data manipulation operations such as indexing, slicing, reshaping, merging, and joining datasets.
- Time Series Functionality: It provides robust support for time series data, including date range generation, frequency conversion, moving window statistics, and more.
- Input/Output Tools: Pandas provides various methods for input and output operations, supporting data import and export from various file formats, including CSV, Excel, SQL databases, and more.
- Data Cleaning and Preprocessing: It offers functionalities for data cleaning, preprocessing, and transformation, including handling duplicates, data normalization, and data categorization.
- Statistical and Mathematical Functions: Pandas provides a wide range of statistical and mathematical functions for data analysis, including descriptive statistics, correlation, covariance, and various aggregations.
- Data Visualization Integration: It integrates well with popular data visualization libraries such as Matplotlib and Seaborn, allowing easy plotting and visualization of data directly from Pandas data structures.
- Grouping and Aggregation: Pandas supports the grouping and aggregation of data, making it easy to perform split-apply-combine operations on datasets.
- Time Zone Handling: It allows easy handling of time zones and conversions, facilitating time-based data analysis and manipulation.
Pandas Interview Questions
Pandas Interview Questions
Data Handling in Pandas
Handling Missing Values in a Pandas DataFrame:
- You can handle missing values using functions like
dropna,fillna, orinterpolate. dropnacan be used to drop rows or columns with missing values.fillnacan be used to fill missing values with a specified value.interpolatecan be used to interpolate missing values based on different methods like linear, time, index, and more.
Handling Duplicates in a DataFrame:
- You can handle duplicates using the
drop_duplicatesfunction. - This function allows you to drop duplicate rows based on specified columns or all columns.
Difference Between loc and iloc in Pandas:
locis label-based, which means that you have to specify the name of the rows and columns that you need to filter out.ilocis integer index-based, meaning that you have to specify the rows and columns by their integer index.
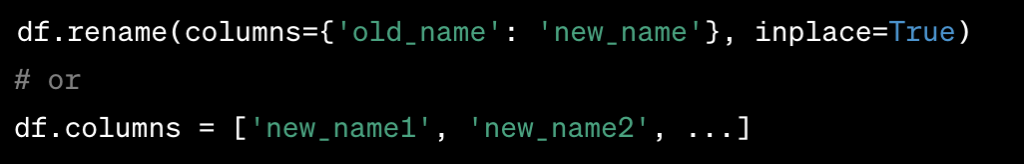
Renaming Columns in a DataFrame:
- To rename columns in a DataFrame, you can use the
renamemethod or directly assign values to thecolumnsattribute of the DataFrame. For example:
Pandas Interview Questions
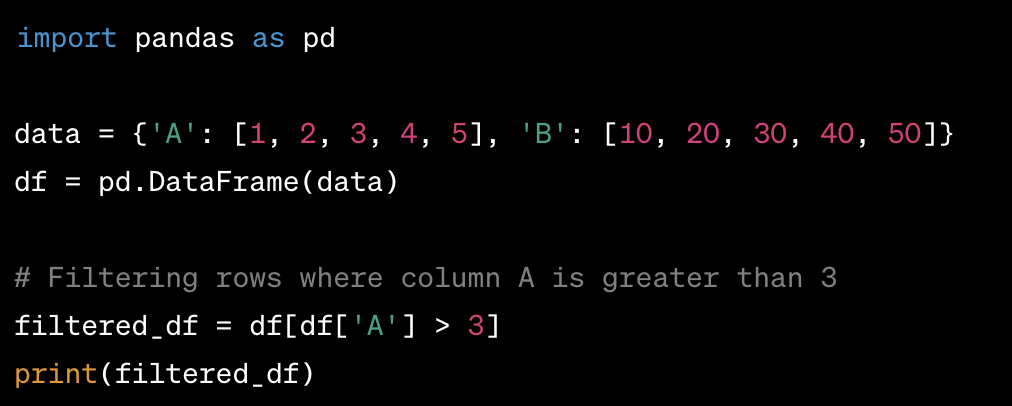
Ways to Filter Rows in a DataFrame based on a Condition:
- You can use Boolean indexing,
loc, orqueryto filter rows based on a condition. - Boolean indexing involves directly passing a Boolean Series to the DataFrame to filter rows.
loccan be used to filter rows based on labels or conditions.querymethod can be used to filter rows based on a string representation of a condition.
Data Manipulation in Pandas
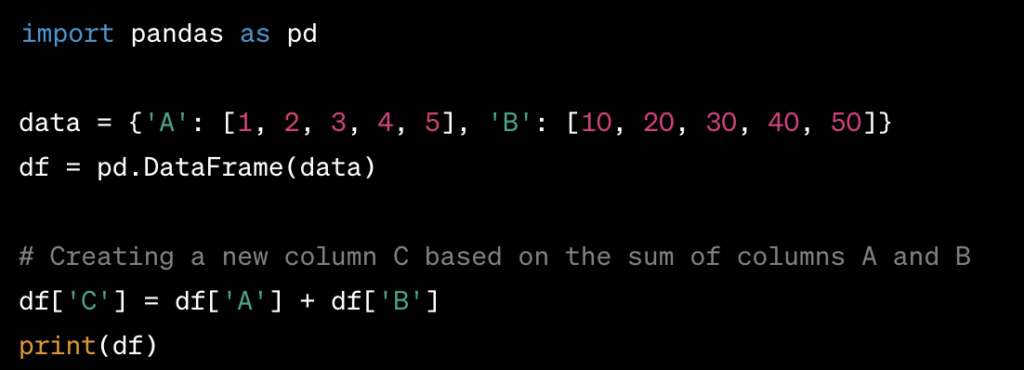
Creating a New Column in a DataFrame based on Values of Other Columns:
- You can create a new column in a DataFrame based on the values of other columns using simple arithmetic operations or functions.
Pandas Interview Questions
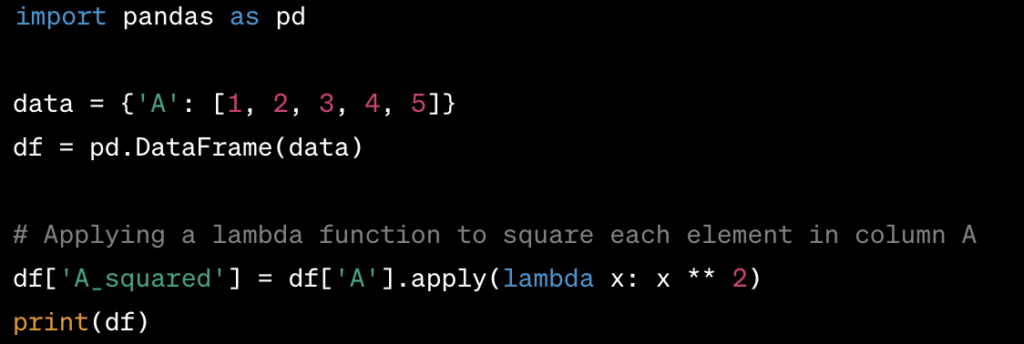
Applying a Function to Each Element of a DataFrame or Series:
- You can use the
applymethod to apply a function along an axis of the DataFrame or Series.
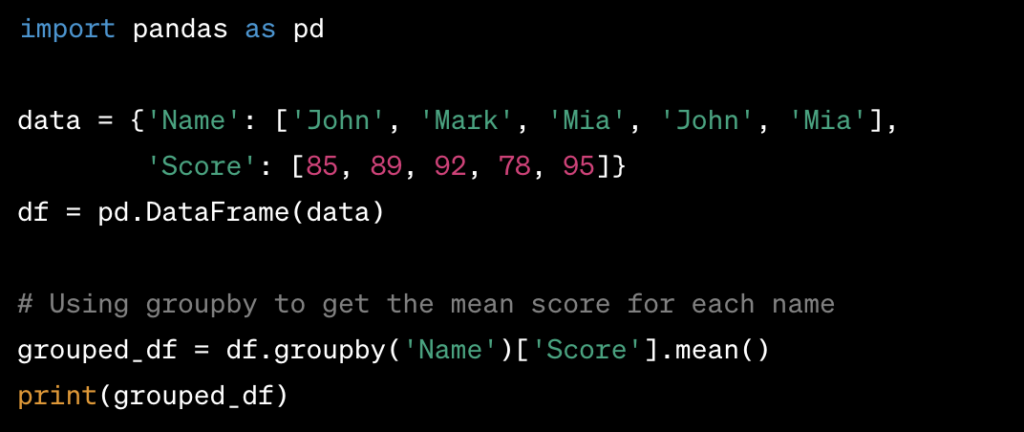
Use of groupby in Pandas:
groupbyis used to split the data into groups based on some criteria.- It involves splitting the data into groups, applying a function to each group independently, and then combining the results.
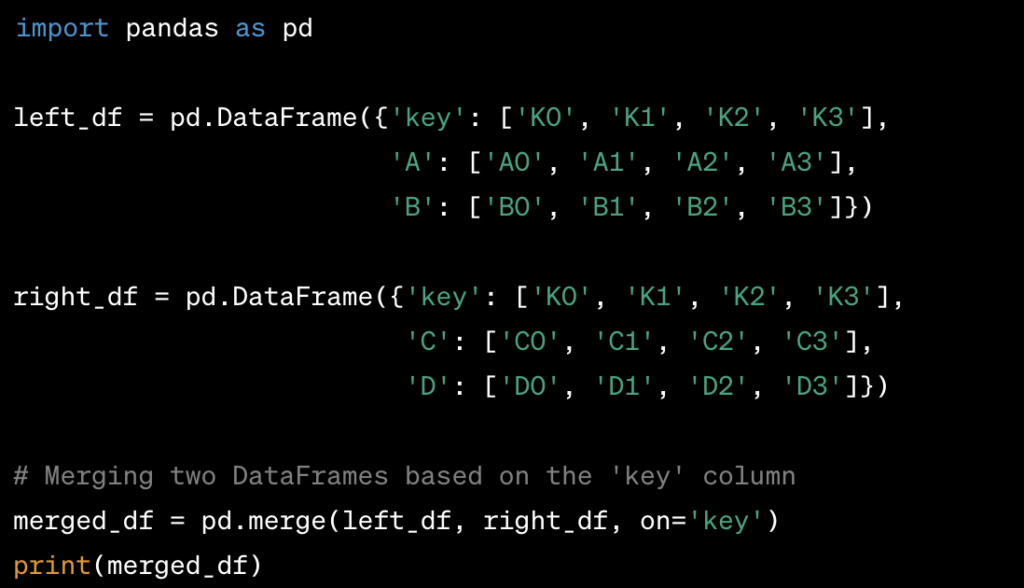
Merging or Joining Two DataFrames in Pandas:
- You can use the
mergefunction to merge two DataFrames based on a common key or keys. - You can also use the
joinmethod to join two DataFrames based on the index.
Time Series Analysis in Pandas
- Handling Time Series Data in Pandas:
- Pandas provides powerful tools for handling time series data. You can use the
DatetimeIndexto represent a time series and take advantage of various time-based functionalities provided by Pandas. - You can set a
DatetimeIndexfor your DataFrame to make time-based operations more convenient. Additionally, you can use theto_datetimefunction to convert a column to aDatetimeIndex.
- Pandas provides powerful tools for handling time series data. You can use the
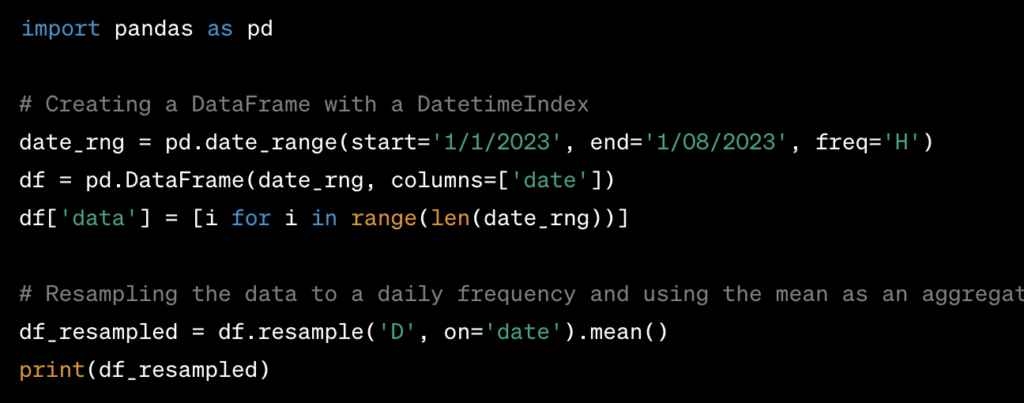
- Resampling Time Series Data to a Different Time Frequency:
- You can use the
resamplemethod in Pandas to change the frequency of your time series data. - You can specify various parameters such as the frequency to which you want to resample (e.g., ‘D’ for day, ‘M’ for month) and the aggregation method to use on the data (e.g., ‘sum’, ‘mean’, ‘last’, etc.).
- You can use the
- Difference Between shift and tshift Functions in Pandas:
shiftis used to shift the data in a DataFrame by a specified number of periods. It operates on the index and the data.tshiftis used to shift the index of the DataFrame by a specified number of time periods. It does not change the actual data, only the index. This is particularly useful for time series data.
Data Visualization in Pandas
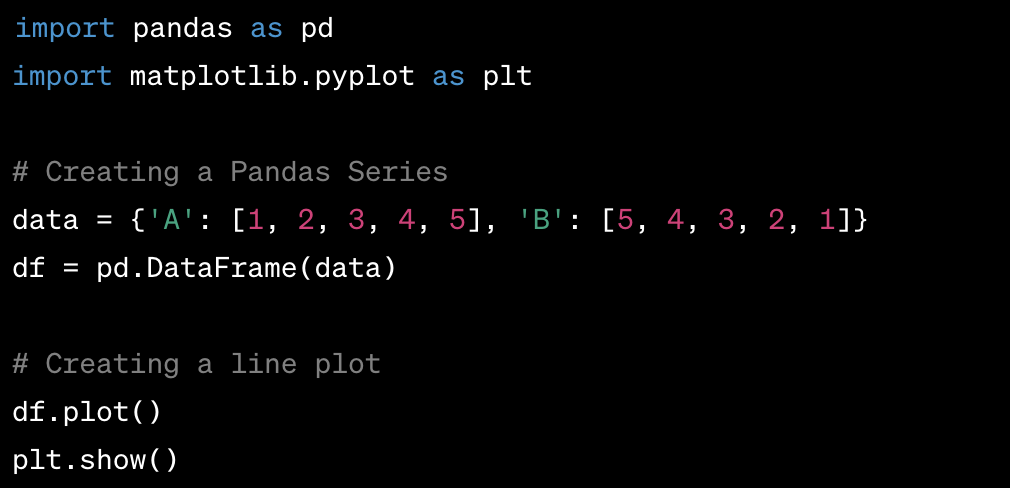
- Creating a Line Plot of a Pandas Series or DataFrame:
- You can create a line plot of a Pandas Series or DataFrame using the
plotmethod provided by Pandas. - This method allows you to quickly visualize data and customize the plot by providing various parameters.
- You can create a line plot of a Pandas Series or DataFrame using the
- Use of the
plotMethod in Pandas:- The
plotmethod in Pandas is a convenient way to create basic visualizations such as line plots, bar plots, histograms, scatter plots, and more. - It is a high-level plotting method that can be applied directly to Series and DataFrames.
- The
plotmethod provides various parameters to customize the appearance of the plot, including labels, titles, colors, and styles.
- The
- Creating a Scatter Plot using Pandas:
- You can create a scatter plot using the
plotmethod in Pandas by specifying thekindparameter as'scatter'. - You can also specify the x and y values that you want to plot using the
xandyparameters.
- You can create a scatter plot using the
Example of creating a scatter plot using Pandas:
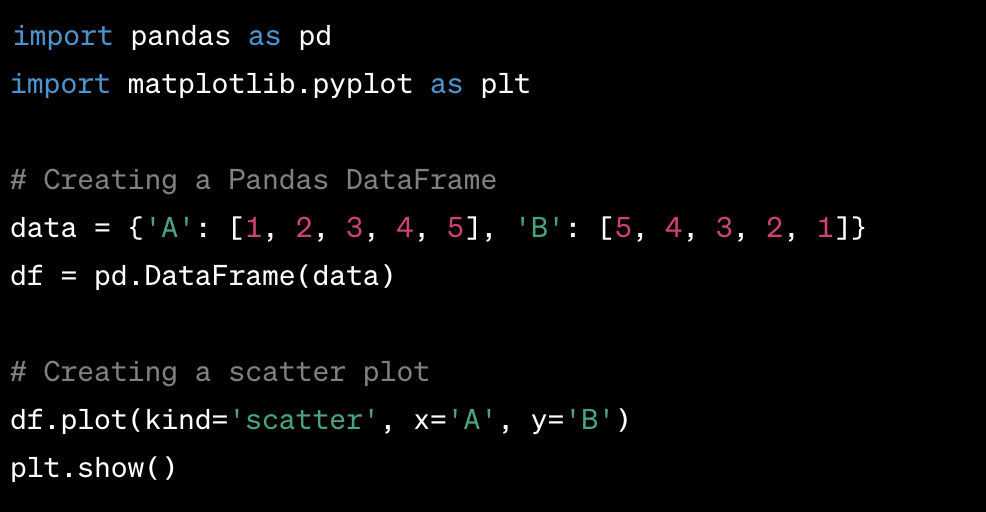
In this example, the plot method is used with the kind parameter set to 'scatter' to create a scatter plot. The x and y parameters are used to specify the columns to be used for the x and y axes, respectively.
Performance Optimization in Pandas
Techniques to Optimize Performance:
- Use Efficient Data Types: Choose appropriate data types for columns to reduce memory usage. For example, using
int32instead ofint64for integer values or usingcategorydata type for columns with a limited number of unique values. - Use Vectorized Operations: Utilize vectorized operations and built-in functions in Pandas instead of iterating over rows. Vectorized operations are generally faster and more efficient.
- Use Chunking: Process data in smaller chunks using the
chunksizeparameter while reading large datasets to reduce memory usage and avoid overwhelming the system. - Use Dask: Dask is a parallel computing library that integrates well with Pandas. It enables parallel and larger-than-memory computations, making it suitable for handling big data.
Handling Memory Issues:
- Load Selective Data: If possible, load only the necessary columns or rows from the dataset to reduce the memory footprint.
- Drop Unnecessary Data: Use the
dropfunction to remove columns or rows that are not required for the analysis, thus reducing the memory usage. - Free Memory After Use: Explicitly release memory using Python’s
delstatement or by setting DataFrames toNoneafter use to allow the garbage collector to reclaim memory. - Optimize Operations in Chunks: Perform operations in smaller chunks, processing data in parts, and storing results incrementally to avoid running out of memory.
- Use Data Compression: Utilize data compression techniques like HDF5, Parquet, or Feather formats for storing and reading data to reduce the memory footprint.
- Increase Virtual Memory: Increase the available virtual memory by using external memory tools or by utilizing cloud computing platforms for processing large datasets.
Advanced Topics in Pandas
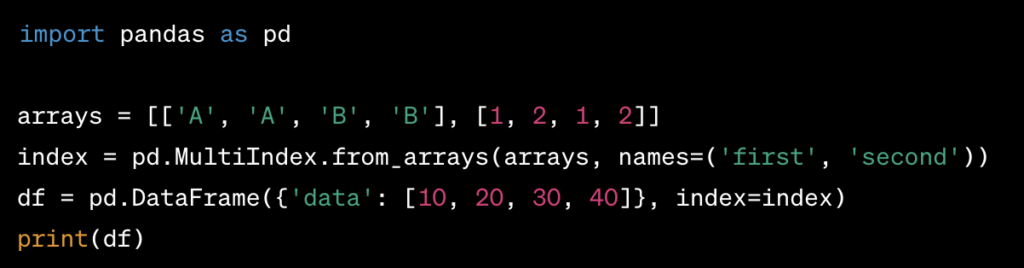
- MultiIndex DataFrames in Pandas:
- MultiIndex DataFrames, also known as hierarchical index DataFrames, allow you to have multiple levels of row and column indices. They are useful for working with high-dimensional data and performing complex analyses.
- You can create a MultiIndex DataFrame by setting multiple indices using the
set_indexmethod or by directly creating a DataFrame with a MultiIndex.
- Working with MultiIndex DataFrames in Pandas:
- You can perform various operations on MultiIndex DataFrames, including indexing, slicing, and grouping, using the
locandilocmethods. - You can also aggregate data at different levels of the index using the
groupbymethod.
- You can perform various operations on MultiIndex DataFrames, including indexing, slicing, and grouping, using the
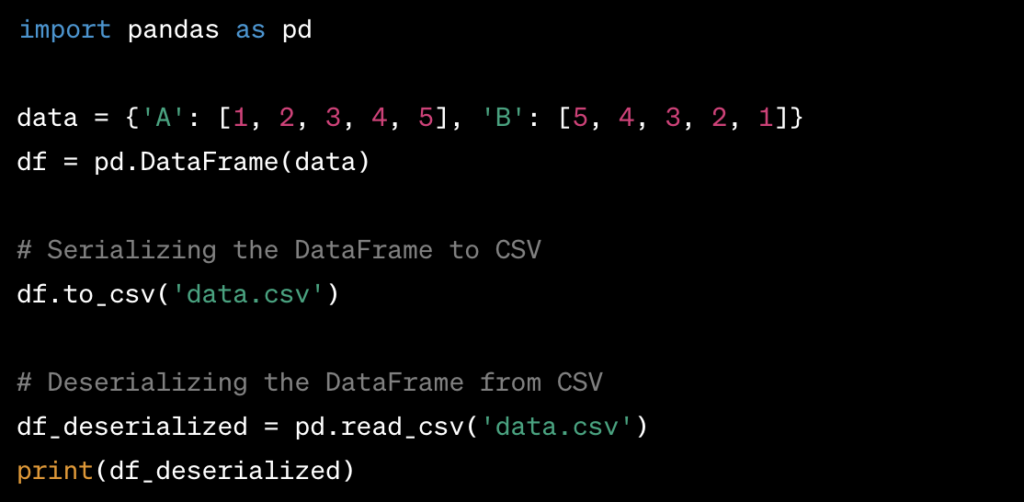
- Serializing and Deserializing a DataFrame using Pandas:
- You can serialize a DataFrame to various formats such as CSV, Excel, JSON, or pickle using the
to_csv,to_excel,to_json, orto_picklemethods. - Similarly, you can deserialize a DataFrame from these formats using the
read_csv,read_excel,read_json, orread_picklemethods.
- You can serialize a DataFrame to various formats such as CSV, Excel, JSON, or pickle using the
- Handling Categorical Data in Pandas:
- Categorical data can be handled in Pandas using the
astype('category')method or by using theCategoricaldata type. - Converting data to categorical format can reduce memory usage and speed up operations.
- You can also use the
cataccessor to perform operations on categorical data, such as renaming categories, reordering categories, or creating new categorical columns.
- Categorical data can be handled in Pandas using the
Here are some examples of how to handle MultiIndex DataFrames, serialize and deserialize DataFrames, and handle categorical data in Pandas:
Pandas Interview Questions
Example of creating a MultiIndex DataFrame:
Example of serializing and deserializing a DataFrame:
Pandas Interview Questions
Our services
- YouTube channel covering all the interview-related important topics in SQL, Python, MS Excel, Machine Learning Algorithm, Statistics, and Direct Interview Questions
Link – The Data Monk Youtube Channel - Website – ~2000 completed solved Interview questions in SQL, Python, ML, and Case Study
Link – The Data Monk website - E-book shop – We have 70+ e-books available on our website and 3 bundles covering 2000+ solved interview questions
Link – The Data E-shop Page - Instagram Page – It covers only Most asked Questions and concepts (100+ posts)
Link – The Data Monk Instagram page - Mock Interviews
Book a slot on Top Mate - Career Guidance/Mentorship
Book a slot on Top Mate - Resume-making and review
Book a slot on Top Mate
The Data Monk e-books
We know that each domain requires a different type of preparation, so we have divided our books in the same way:
✅ Data Analyst and Product Analyst -> 1100+ Most Asked Interview Questions
✅ Business Analyst -> 1250+ Most Asked Interview Questions
✅ Data Scientist and Machine Learning Engineer -> 23 e-books covering all the ML Algorithms Interview Questions
✅ Full Stack Analytics Professional – 2200 Most Asked Interview Questions
The Data Monk – 30 Days Mentorship program
We are a group of 30+ people with ~8 years of Analytics experience in product-based companies. We take interviews on a daily basis for our organization and we very well know what is asked in the interviews.
Other skill enhancer websites charge 2lakh+ GST for courses ranging from 10 to 15 months.
We only focus on making you a clear interview with ease. We have released our Become a Full Stack Analytics Professional for anyone in 2nd year of graduation to 8-10 YOE. This book contains 23 topics and each topic is divided into 50/100/200/250 questions and answers. Pick the book and read
it thrice, learn it, and appear in the interview.
We also have a complete Analytics interview package
– 2200 questions ebook (Rs.1999) + 23 ebook bundle for Data Science and Analyst role (Rs.1999)
– 4 one-hour mock interviews, every Saturday (top mate – Rs.1000 per interview)
– 4 career guidance sessions, 30 mins each on every Sunday (top mate – Rs.500 per session)
– Resume review and improvement (Top mate – Rs.500 per review)
Total cost – Rs.10500
Discounted price – Rs. 9000
How to avail of this offer?
Send a mail to nitinkamal132@gmail.com