Pandas Complete Tutorial
In layman’s terms, Pandas is like a powerful, easy-to-use toolbox for handling and playing with data in the Python programming language. Imagine you have a large table of information, like a spreadsheet, and you want to do all sorts of things with it – filter rows, add new columns, group data, and perform calculations. Pandas is the tool that makes these tasks easier.
Just like a toolbox has different tools for different jobs, Pandas has two main tools: DataFrame and Series.
- DataFrame is like a table in a database or an Excel spreadsheet. It has rows and columns, and each column can be a different type of data (numbers, text, dates, etc.).
- Series is like a single column or a single row in that table. It’s a one-dimensional array that can hold any data type.
With Pandas, you can easily read data from various sources (like CSV files or databases), manipulate it in various ways, and analyze it. Whether you’re a scientist exploring data, a business analyst working with sales figures, or just someone who loves playing with numbers, Pandas is there to help you do it efficiently and with less hassle. It’s a key tool in the data science and analysis toolkit for Python.
Pandas Complete Tutorial
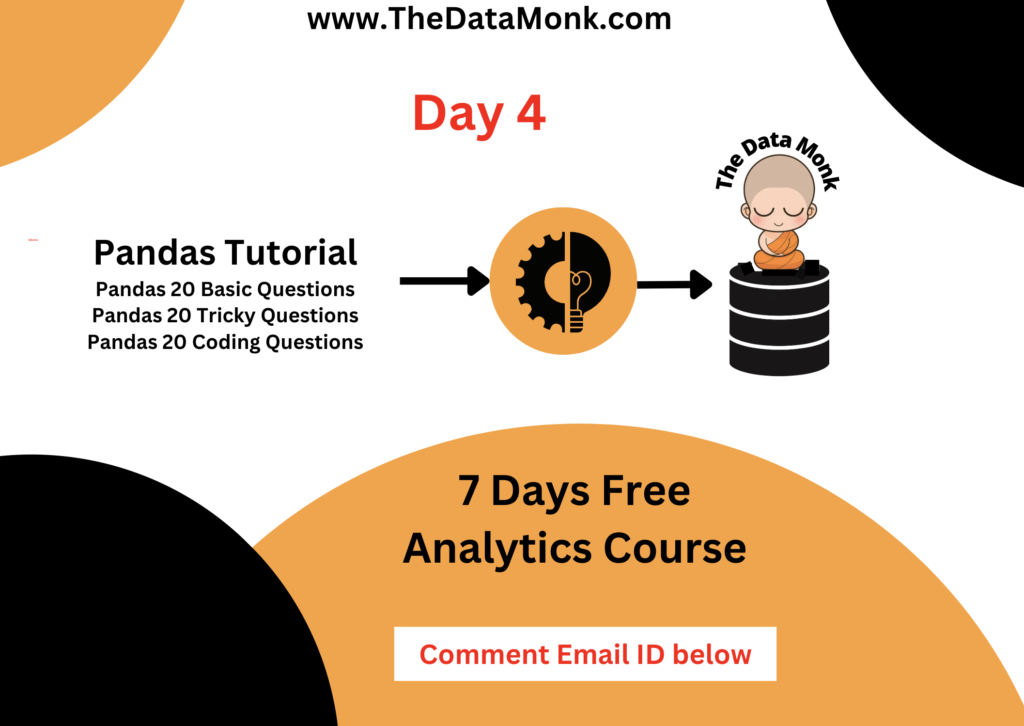
Pandas 20 Basic Questions
- What is Pandas?
- Pandas is an open-source data manipulation and analysis library for Python.
- Pandas is an open-source data manipulation and analysis library for Python.
- Explain the primary data structures in Pandas.
- The primary data structures in Pandas are Series and DataFrame.
- The primary data structures in Pandas are Series and DataFrame.
- What is the difference between a Series and a DataFrame?
- A Series is a one-dimensional array with labeled indices, while a DataFrame is a two-dimensional table with labeled rows and columns.
- A Series is a one-dimensional array with labeled indices, while a DataFrame is a two-dimensional table with labeled rows and columns.
- How do you import Pandas in Python?
- You can import Pandas using the statement:
import pandas as pd.
- You can import Pandas using the statement:
- How do you create a DataFrame in Pandas?
- You can create a DataFrame using the
pd.DataFrame()constructor or by reading data from various file formats.
- You can create a DataFrame using the
- Explain the purpose of the
head()andtail()functions in Pandas.head()displays the first few rows of a DataFrame, andtail()displays the last few rows.
- What is the role of the
loc[]andiloc[]functions in Pandas?loc[]is used for label-based indexing, andiloc[]is used for integer-based indexing in Pandas.
- How do you handle missing values in a DataFrame?
- Missing values can be handled using functions like
dropna(),fillna(), orinterpolate().
- Missing values can be handled using functions like
- Explain the purpose of the
groupby()function in Pandas.groupby()is used for grouping data based on some criteria and then applying a function to each group independently.
- What is the purpose of the
merge()function in Pandas?merge()is used for combining two DataFrames based on a common column or index.
- How can you rename columns in a DataFrame?
- You can use the
rename()method or directly assign new column names to thecolumnsattribute.
- You can use the
- What is the purpose of the
pivot_table()function in Pandas?pivot_table()is used for creating a spreadsheet-style pivot table as a DataFrame.
- How do you perform arithmetic operations on two DataFrames in Pandas?
- Pandas allows you to perform element-wise operations between two DataFrames using standard arithmetic operators.
- Pandas allows you to perform element-wise operations between two DataFrames using standard arithmetic operators.
- Explain the use of the
apply()function in Pandas.apply()is used for applying a function along the axis of a DataFrame or Series.
- How do you handle duplicate values in a DataFrame?
- Duplicate values can be handled using functions like
duplicated()anddrop_duplicates().
- Duplicate values can be handled using functions like
- What is the purpose of the
isin()function in Pandas?isin()is used for filtering data frames. It returns a Boolean series indicating whether each element in the Series or DataFrame is contained in a list.
- Explain the concept of melting in Pandas.
- Melting is the process of transforming a DataFrame from wide format to long format using the
melt()function.
- Melting is the process of transforming a DataFrame from wide format to long format using the
- How can you reset the index of a DataFrame?
- You can use the
reset_index()method to reset the index of a DataFrame.
- You can use the
- What is the purpose of the
to_csv()andto_excel()functions in Pandas?to_csv()is used to write a DataFrame to a CSV file, andto_excel()is used to write a DataFrame to an Excel file.
- How can you handle datetime objects in Pandas?
- Pandas provides a
DateTimedata type and functions liketo_datetime()andstrftime()for working with datetime objects.
- Pandas provides a
Pandas 20 Basic Coding Questions
- Create a DataFrame:
data = {'Name': ['Alice', 'Bob', 'Charlie'], 'Age': [25, 30, 35], 'City': ['New York', 'San Francisco', 'Los Angeles']} - Select the ‘Name’ and ‘Age’ columns from a DataFrame named
dfdf[['Name', 'Age']] - Filter rows in a DataFrame where the ‘Age’ is greater than 25
df[df['Age'] > 25] - Calculate the mean of the ‘Age’ column in a DataFrame.
df['Age'].mean() - Add a new column ‘Salary’ with values [50000, 60000, 70000] to the DataFrame.
df['Salary'] = [50000, 60000, 70000] - Remove the ‘City’ column from the DataFrame.
df.drop('City', axis=1, inplace=True) - Sort the DataFrame based on the ‘Age’ column in descending order.
df.sort_values(by='Age', ascending=False, inplace=True) - Concatenate two DataFrames named
df1anddf2vertically.pd.concat([df1, df2], axis=0) - Merge two DataFrames
df1anddf2based on a common column ‘ID’.pd.merge(df1, df2, on='ID') - Replace all occurrences of ‘Male’ with ‘M’ in the ‘Gender’ column.
df['Gender'].replace('Male', 'M', inplace=True) - Create a new column ‘Age Group’ with values ‘Young’ for ages < 30, ‘Middle’ for ages 30-50, and ‘Old’ for ages > 50.
df['Age Group'] = pd.cut(df['Age'], bins=[0, 30, 50, float('inf')], labels=['Young', 'Middle', 'Old']) - Transpose the rows and columns of a DataFrame.
df.transpose() - Create a pivot table with ‘Name’ as the index, ‘City’ as columns, and ‘Age’ as values.
pd.pivot_table(df, values='Age', index='Name', columns='City') - Check for missing values in a DataFrame.
df.isnull().sum() - Fill missing values in the ‘Salary’ column with the mean salary.
df['Salary'].fillna(df['Salary'].mean(), inplace=True) - Calculate the cumulative sum of the ‘Age’ column.
df['Age'].cumsum() - Count the number of unique values in the ‘City’ column.
df['City'].nunique() - Create a new DataFrame that includes only rows with unique values based on the ‘Name’ column.
df_unique = df.drop_duplicates(subset='Name') - Calculate the correlation matrix for numerical columns in a DataFrame.
df.corr() - Create a new column ‘Senior’ with values ‘Yes’ for individuals aged 60 or above, and ‘No’ otherwise.
df['Senior'] = np.where(df['Age'] >= 60, 'Yes', 'No')
Pandas 20 Coding Questions
- Explain the difference between loc and iloc in Pandas with an example.
locis label-based indexing, whileilocis integer-based indexing.- Example:
df = pd.DataFrame({'A': [1, 2, 3]}, index=['one', 'two', 'three']) print(df.loc['one'])# Selects row with label 'one'print(df.iloc[0])# Selects the first row (integer index 0)
- How do you randomly sample 5 rows from a DataFrame?
df_sample = df.sample(n=5) - Given a DataFrame df with a column ‘A’ containing strings, how do you find the length of each string in the ‘A’ column?
df['Length'] = df['A'].apply(len) - Explain the purpose of the transform() function in Pandas. Provide an example.
transform()is used to perform operations on groups of data and return a transformed version with the same shape.- Example:
df['GroupSum'] = df.groupby('Group')['Value'].transform('sum')
- Create a DataFrame with a DateTime column. How would you filter the DataFrame to include only rows from the year 2022?
df['DateTime'] = pd.to_datetime(df['DateTime'])df_2022 = df[df['DateTime'].dt.year == 2022] - Given a DataFrame, how do you find the top 3 most frequent values in a specific column?
top3_values = df['Column'].value_counts().nlargest(3) - Explain the concept of method chaining in Pandas with an example.
- Method chaining is a way of combining multiple Pandas operations in a single line.
- Example:
result = df.dropna().groupby('Category').mean().sort_values('Value')
- How would you handle a situation where you have multiple DataFrames with the same column names, and you need to concatenate them vertically while preserving the column names?
df_concatenated = pd.concat([df1, df2], ignore_index=True) - Given a DataFrame with a column ‘Amount’ containing both positive and negative values, how do you create a new column that accumulates the sum, resetting to zero whenever a negative value is encountered?
df['AccumulatedSum'] = df['Amount'].cumsum().where(df['Amount'] >= 0, 0) - Create a DataFrame with a column of dates and another column of values. How would you resample the DataFrame to have a monthly frequency, filling missing values with the average of the surrounding values?
df_resampled = df.resample('M').asfreq().interpolate() - Explain the purpose of the get_dummies() function in Pandas and provide a scenario where it might be useful.
get_dummies()is used for one-hot encoding categorical variables.- Example:
df_encoded = pd.get_dummies(df, columns=['Category'])
- Given a DataFrame with duplicate rows, how would you remove duplicates based on a specific column while keeping the row with the highest value in another column?
df_no_duplicates = df.sort_values('ValueColumn', ascending=False).drop_duplicates('KeyColumn') - How do you calculate the rolling average of a column in a DataFrame?
df['RollingAverage'] = df['Column'].rolling(window=3).mean() - Given a DataFrame with a column ‘Text’ containing sentences, how do you count the occurrences of each word across all sentences?
word_counts = df['Text'].str.split().explode().value_counts() - Explain the eval() function in Pandas with an example.
eval()allows you to perform expression evaluation on DataFrame columns.- Example:
df.eval('Result = Column1 + Column2', inplace=True)
- Given a DataFrame with a column of lists, how do you explode the lists into separate rows while duplicating the values in other columns?
df_exploded = df.explode('ListColumn') - How can you efficiently calculate the percentage change for each element in a DataFrame compared to the previous row?
df['PercentageChange'] = df['Column'].pct_change() * 100 - Create a DataFrame with a column of strings. How would you extract the second word from each string and create a new column with these second words?
df['SecondWord'] = df['StringColumn'].str.split().str[1] - Explain the purpose of the at_time() function in Pandas.
at_time()is used to select data at a particular time of day.- Example:
df_at_12pm = df.at_time('12:00')
- Given a DataFrame with a hierarchical index, how do you swap the levels of the index?
df_swapped = df.swaplevel(i=0, j=1)
Our services
- YouTube channel covering all the interview-related important topics in SQL, Python, MS Excel, Machine Learning Algorithm, Statistics, and Direct Interview Questions
Link – The Data Monk Youtube Channel - Website – ~2000 completed solved Interview questions in SQL, Python, ML, and Case Study
Link – The Data Monk website - E-book shop – We have 70+ e-books available on our website and 3 bundles covering 2000+ solved interview questions
Link – The Data E-shop Page - Instagram Page – It covers only Most asked Questions and concepts (100+ posts)
Link – The Data Monk Instagram page - Mock Interviews
Book a slot on Top Mate - Career Guidance/Mentorship
Book a slot on Top Mate - Resume-making and review
Book a slot on Top Mate
The Data Monk e-books
We know that each domain requires a different type of preparation, so we have divided our books in the same way:
✅ Data Analyst and Product Analyst -> 1100+ Most Asked Interview Questions
✅ Business Analyst -> 1250+ Most Asked Interview Questions
✅ Data Scientist and Machine Learning Engineer -> 23 e-books covering all the ML Algorithms Interview Questions
✅ Full Stack Analytics Professional – 2200 Most Asked Interview Questions
The Data Monk – 30 Days Mentorship program
We are a group of 30+ people with ~8 years of Analytics experience in product-based companies. We take interviews on a daily basis for our organization and we very well know what is asked in the interviews.
Other skill enhancer websites charge 2lakh+ GST for courses ranging from 10 to 15 months.
We only focus on making you a clear interview with ease. We have released our Become a Full Stack Analytics Professional for anyone in 2nd year of graduation to 8-10 YOE. This book contains 23 topics and each topic is divided into 50/100/200/250 questions and answers. Pick the book and read
it thrice, learn it, and appear in the interview.
We also have a complete Analytics interview package
– 2200 questions ebook (Rs.1999) + 23 ebook bundle for Data Science and Analyst role (Rs.1999)
– 4 one-hour mock interviews, every Saturday (top mate – Rs.1000 per interview)
– 4 career guidance sessions, 30 mins each on every Sunday (top mate – Rs.500 per session)
– Resume review and improvement (Top mate – Rs.500 per review)
Total cost – Rs.10500
Discounted price – Rs. 9000