Mastering Pandas for Analytics
Pandas is a go-to library for data manipulation and analysis in Python. It provides powerful tools for working with structured data, making it a crucial skill for data scientists and analysts. When preparing for a Pandas interview, you’ll likely encounter tricky questions that test your knowledge of this library’s inner workings. In this article, we’ll explore a range of challenging Pandas interview questions and provide detailed answers to help you excel in your interview.
Mastering Pandas for Analytics
Day 1 – SQL Tricky Interview Questions – Day 1
Pandas Interview Questions
DataFrame vs. Series
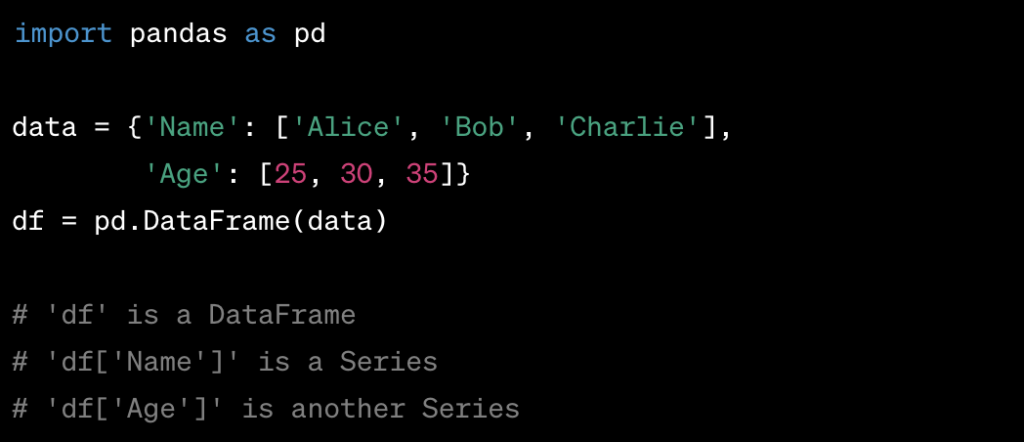
Question: Explain the difference between a Pandas DataFrame and a Series.
Answer: In Pandas, both DataFrames and Series are fundamental data structures, but they serve different purposes.
- DataFrame: A DataFrame is a two-dimensional, tabular data structure with rows and columns. It is similar to a spreadsheet or SQL table and can store heterogeneous data types. You can think of a DataFrame as a collection of Series objects, where each column is a Series.
- Series: A Series is a one-dimensional labeled array capable of holding data of any type. It is like a single column of a DataFrame or a labeled array. Series objects have both data and index labels.
Here’s a simple example to illustrate the difference:
Handling Missing Data
Question: What strategies can you use to handle missing data in a Pandas DataFrame?
Answer: Handling missing data is a common data cleaning task. Pandas provides several methods to deal with missing values:
isna() and notna(): These methods can be used to detect missing (NaN) values in a DataFrame or Series. For example, df.isna() returns a DataFrame of the same shape as df, with True where NaN values exist and False where data is present.
dropna(): This method removes rows or columns containing missing values. You can specify the axis and how to handle missing values using the how parameter.
fillna(): This method fills missing values with specified values or strategies. You can fill NaN values with a constant, the mean, median, or forward/backward fill.
Imputation: Imputation is the process of replacing missing values with estimated or calculated values. You can use statistical techniques such as mean, median, or machine learning models for imputation.
Interpolation: Interpolation is a method for estimating missing values based on surrounding data points. Pandas offers various interpolation methods like linear, polynomial, and spline.
GroupBy Operations
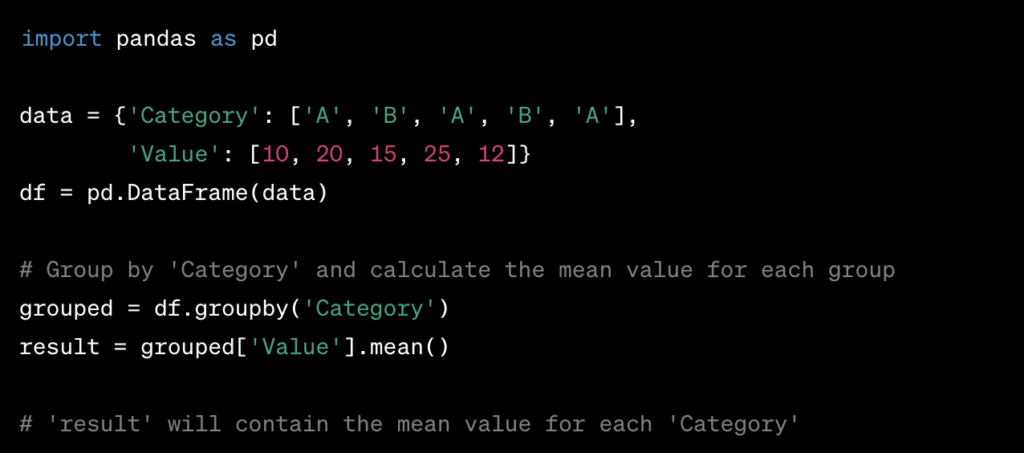
Question: Explain the purpose of the Pandas groupby() function and provide an example.
Answer: The groupby() function in Pandas is used for grouping data in a DataFrame based on one or more columns. It allows you to split a DataFrame into groups based on some criteria and then apply a function to each group independently.
Here’s a simple example:
Merging and Joining DataFrames
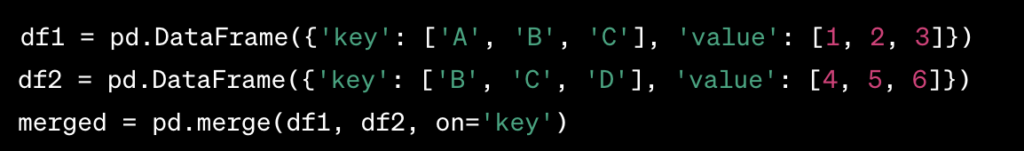
Question: Explain the difference between merging and joining DataFrames in Pandas.
Answer: In Pandas, both merging and joining involve combining multiple DataFrames into a single DataFrame, but they are used in slightly different contexts:
Merging: Merging is the process of combining DataFrames based on the values of common columns. You specify which columns to use as keys, and Pandas matches rows based on those keys.Example:
Joining: Joining is a special case of merging where you combine DataFrames based on their indexes or row labels. The join() method in Pandas is used for this purpose.
Example:
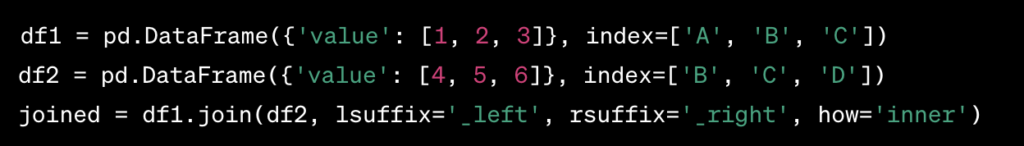
The key difference is that merging is based on columns, while joining is based on indexes or row labels. The choice between them depends on your specific data and use case.
Reshaping Data
Question: Explain the concepts of “melting” and “pivoting” in Pandas, and provide examples.
Answer: “Melting” and “pivoting” are techniques used to reshape data in Pandas.
Melting: Melting is the process of converting a DataFrame from a wide format to a long format. It unpivots the data by turning columns into rows.Example:
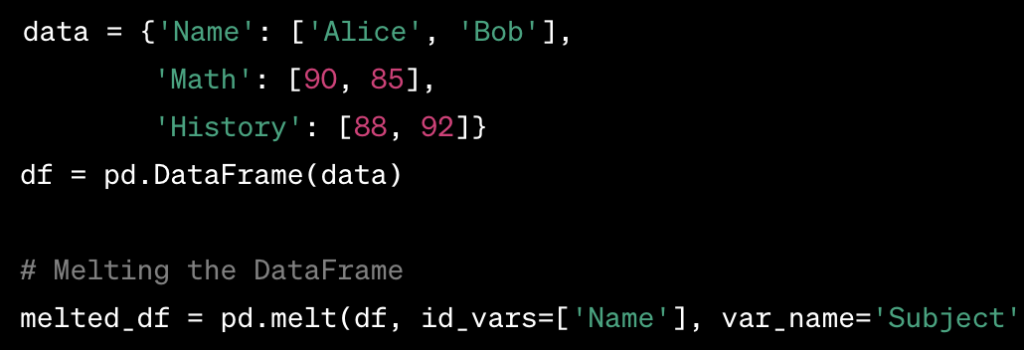
- In this example, we melt the original DataFrame, and each row now represents a single observation (a student’s score for a subject).
- Pivoting: Pivoting is the opposite of melting. It transforms a long-format DataFrame back into a wide format, making it easier to analyze.Example:

- Pivoting the melted DataFrame returns it to its original wide format, where each column represents a subject, and each row represents a student.
These techniques are useful for transforming data to make it more suitable for analysis or visualization.
Time Series Data
Question: How can you work with time series data in Pandas, and what is the significance of the datetime data type?
Answer: Time series data involves data points recorded or measured at specific time intervals. Pandas provides robust support for working with time series data through the datetime data type and various time-related functions.
Key concepts and operations for working with time series data in Pandas include:
- Datetime Index: In Pandas, you can set a datetime column as the index of your DataFrame. This allows you to perform time-based indexing, slicing, and grouping.
- Resampling: You can resample time series data to aggregate or interpolate data over different time frequencies (e.g., from daily to monthly data).
- Time-based Slicing: Pandas allows you to select data within a specific time range or based on specific dates.
- Shifting and Lagging: You can shift time series data forward or backward in time to calculate differences or create lag features.
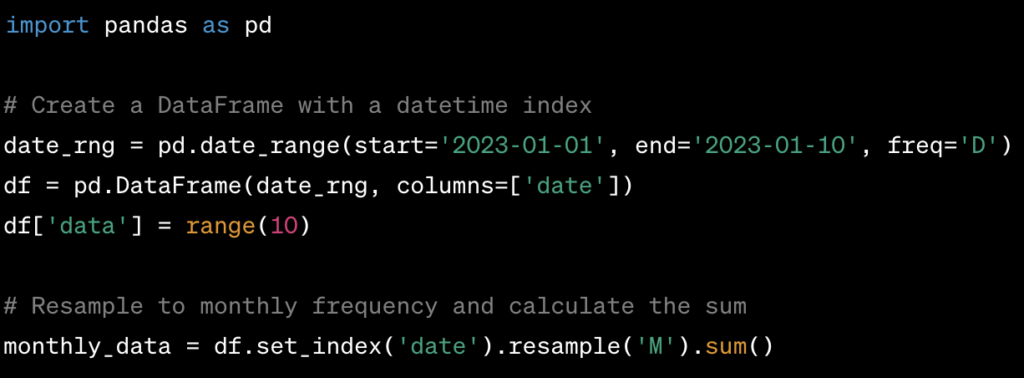
In this example, we create a DataFrame with a datetime index, resample it to monthly frequency, and calculate the sum of data within each month.
Performance Optimization
Question: How can you optimize the performance of Pandas operations on large datasets?
Answer: Pandas is a powerful library, but it can become slow on large datasets. To optimize performance, consider the following strategies:
- Use Vectorized Operations: Pandas is designed for vectorized operations. Whenever possible, avoid iterating over rows and use built-in Pandas functions for calculations.
- Select Relevant Columns: Only select the columns you need for your analysis. This reduces memory usage and speeds up operations.
- Use
astype()for Data Type Optimization: If your DataFrame contains columns with inappropriate data types, use theastype()method to convert them to more memory-efficient types (e.g., fromfloat64tofloat32). - Leverage Categorical Data: For columns with a limited number of unique values, consider converting them to categorical data types. This can reduce memory usage and speed up operations.
- Chunk Processing: For very large datasets that don’t fit into memory, process data in smaller chunks using the
read_csv()orread_sql()functions with thechunksizeparameter. - Parallel Processing: Utilize libraries like Dask or Vaex that allow parallel and out-of-core processing for large datasets.
Handling Duplicate Data
Question: How can you identify and handle duplicate rows in a Pandas DataFrame?
Answer: Duplicate rows can occur in a DataFrame, and it’s essential to identify and handle them effectively. Pandas provides methods for these tasks:
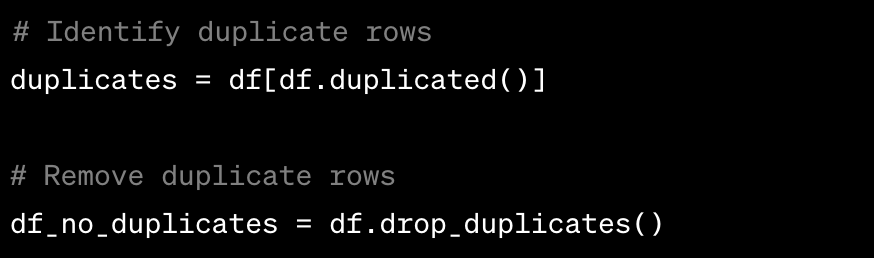
- Identifying Duplicates: To identify duplicate rows, you can use the
duplicated()method to create a boolean mask indicating which rows are duplicates. Thedrop_duplicates()method removes duplicate rows.Example:
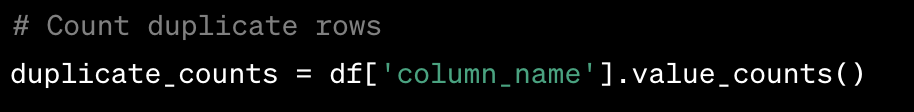
Counting Duplicates: To count the occurrences of each unique row, you can use the value_counts() method.
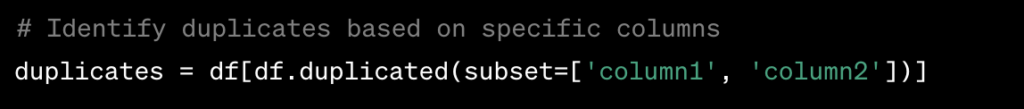
Handling Duplicates Based on Columns: You can specify specific columns to identify duplicates. For example, to consider only two columns for duplicates, use the subset parameter.
Handling duplicate data is crucial for maintaining data quality and ensuring accurate analysis.
Time Zone Handling
Question: How can you work with time zones in Pandas, and what is the role of the tz attribute?
Answer: Pandas provides excellent support for working with time zones through the pytz library and the tz attribute.
Key concepts for handling time zones in Pandas include:
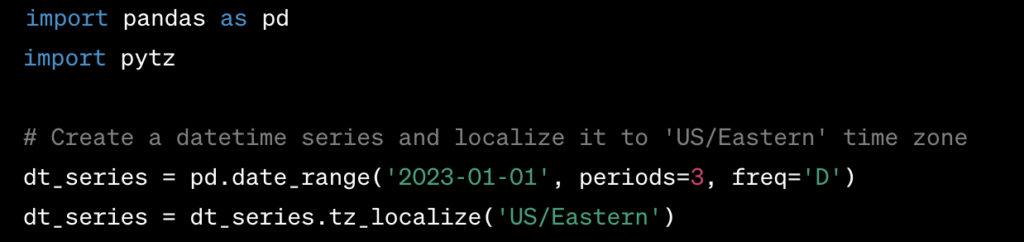
Time Zone Localization: You can localize a naive (timezone-unaware) datetime series by specifying a time zone using the tz_localize() method.Example:
Time Zone Conversion: You can convert datetime series from one time zone to another using the tz_convert() method.
Example:

tzAttribute: Thetzattribute of a datetime series indicates the time zone information. It can beNonefor naive datetimes or set to a specific time zone usingtz_localize()ortz_convert().
Time zone handling is crucial when working with data that spans different regions or when dealing with data collected at different times across the world.
Advanced Filtering and Selection
Question: How can you perform advanced filtering and selection of data in a Pandas DataFrame?
Answer: Pandas offers several advanced techniques for filtering and selecting data based on complex conditions:
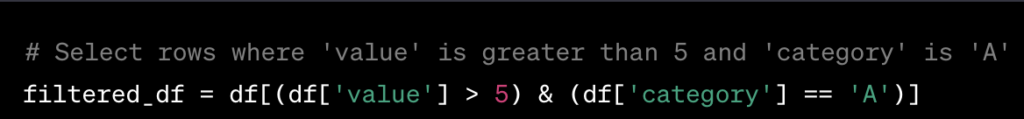
- Boolean Indexing: You can use boolean expressions to create complex filters and select rows meeting specific criteria.Example:
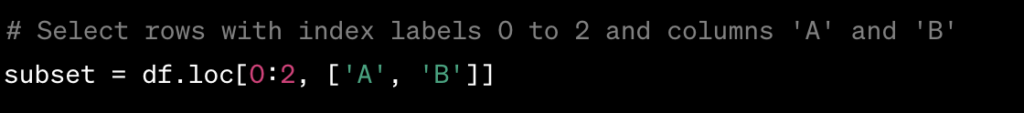
.loc[] and .iloc[]: The .loc[] method allows label-based selection, while .iloc[] enables integer-based selection of rows and columns.
Example:
query() Method: The query() method allows you to write SQL-like queries to filter dataframes.
Example:

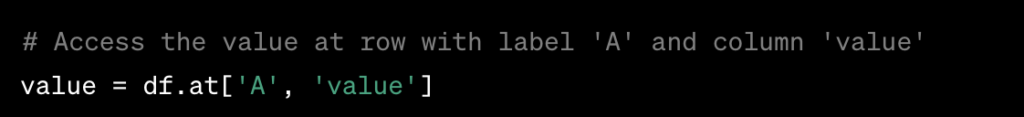
.at[] and .iat[]: These methods allow for fast access to single values in a DataFrame using labels or integer-based indexing.
Example:
Thanks for reading the content, please revise and makes notes of these topics if needed, do follow our daily blog
How The Data Monk can help you?
We have created products and services on different platforms to help you in your Analytics journey irrespective of whether you want to switch to a new job or want to move into Analytics.
Our services
- YouTube channel covering all the interview-related important topics in SQL, Python, MS Excel, Machine Learning Algorithm, Statistics, and Direct Interview Questions
Link – The Data Monk Youtube Channel - Website – ~2000 completed solved Interview questions in SQL, Python, ML, and Case Study
Link – The Data Monk website - E-book shop – We have 70+ e-books available on our website and 3 bundles covering 2000+ solved interview questions
Link – The Data E-shop Page - Instagram Page – It covers only Most asked Questions and concepts (100+ posts)
Link – The Data Monk Instagram page - Mock Interviews
Book a slot on Top Mate - Career Guidance/Mentorship
Book a slot on Top Mate - Resume-making and review
Book a slot on Top Mate
The Data Monk e-books
We know that each domain requires a different type of preparation, so we have divided our books in the same way:
✅ Data Analyst and Product Analyst -> 1100+ Most Asked Interview Questions
✅ Business Analyst -> 1250+ Most Asked Interview Questions
✅ Data Scientist and Machine Learning Engineer -> 23 e-books covering all the ML Algorithms Interview Questions
✅ Full Stack Analytics Professional – 2200 Most Asked Interview Questions
The Data Monk – 30 Days Mentorship program
We are a group of 30+ people with ~8 years of Analytics experience in product-based companies. We take interviews on a daily basis for our organization and we very well know what is asked in the interviews.
Other skill enhancer website charge 2lakh+ GST for courses ranging from 10 to 15 months.
We only focus on making you a clear interview with ease. We have released our Become a Full Stack Analytics Professional for anyone in 2nd year of graduation to 8-10 YOE. This book contains 23 topics and each topic is divided into 50/100/200/250 questions and answers. Pick the book and read it thrice, learn it, and appear in the interview.
We also have a complete Analytics interview package
– 2200 questions ebook (Rs.1999) + 23 ebook bundle for Data Science and Analyst role (Rs.1999)
– 4 one-hour mock interviews, every Saturday (top mate – Rs.1000 per interview)
– 4 career guidance sessions, 30 mins each on every Sunday (top mate – Rs.500 per session)
– Resume review and improvement (Top mate – Rs.500 per review)
Total cost – Rs.10500
Discounted price – Rs. 9000
How to avail of this offer?
Send a mail to nitinkamal132@gmail.com