The below article is the intellectual property of Ashish Kohli. This is one such article which actually powers the ability of SQL. Give it a read guys.
Yes, you read that one right! One of the most fundamental machine learning algorithms out there is Linear Regression. In simple words, it is a technique to describe a relationship between a response(a.k.a dependent) variable and one or more explanatory (a.k.a independent) variable(s). After doing some reading into the “math” behind these algorithms, I realized that this can be easily achieved in SQL.
I don’t intend to turn this post into another “Machine Learning 101”. There are plenty of such articles out there that explain what Linear Regression is in a much better way, including some nitty-gritty details like it’s back-end optimization algorithm, i.e. Gradient Descent. I will thus try to keep this article as less “ML”ly as possible. However, I’d recommend this 9 byte-sized (typo intended!) article series that explains all this and some more in a really easy language. Also, for most of this post, I will be referring to the formulas and notations used in the hyperlinked article.
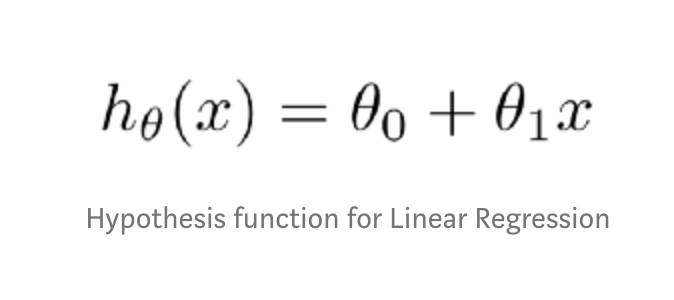
Alright! At this point, I hope that you already know about the concepts of Linear Regression and how Gradient Descent works. And thus you’ll also know that the relationship between response and explanatory variable(s) is explained by the following equation :
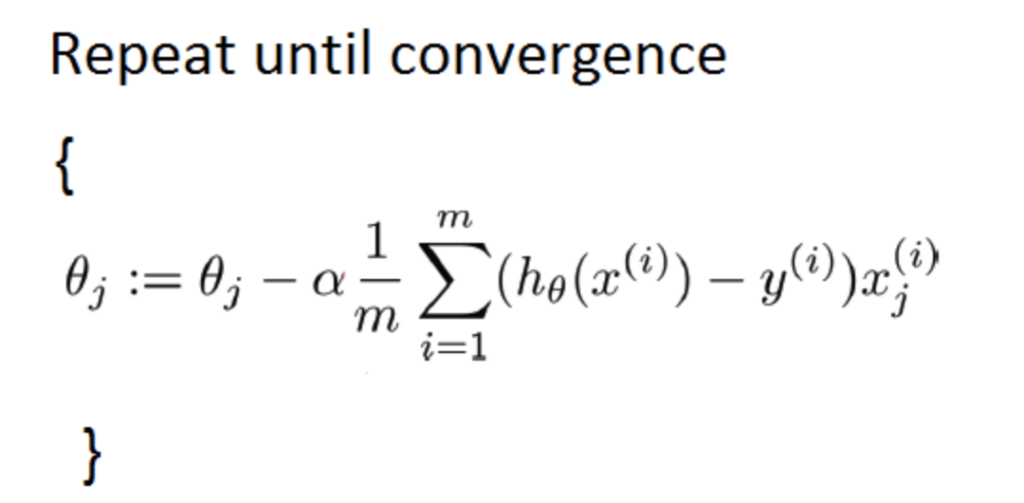
The goal of Linear Regression is to find the optimal value of θ (theta) that best describes the relationship between two variables and Gradient Descent is the way to do that. The equation given below summarizes how Gradient Descent arrives at the optimal value of θ(s).

Let’s list down the activities that are needed to be performed to arrive at optimal values of θ:
- Start with random values of θ and calculate the value of hypothesis function (Hθ)
- Fill in the values of θ and Hθ in the convergence equation to get new values of θ
- Keep repeating Step 2 until the values of θ don’t change anymore
- These values of θ correspond to the minimum cost (or error) for the Hypothesis function
- Fill in the final values of θ in the hypothesis function to get Predicted values of the response variable
Step 1: Declaring & Initializing variables
We need 6 variables, each for a different purpose:
- theta0, theta1 to store the current value of θ0, θ1
- theta0_t, theta1_t to store temporary values of θ0 & θ1 before updating the original ones
- var (short for variability) to check if the updated value of θ is approaching “near” the current value or not
- alpha to store learning rate (read this answer at Quora to understand all about learning rate)
DECLARE @theta0 int;
DECLARE @theta1 int;
DECLARE @theta0_t int;
DECLARE @theta1_t int;
DECLARE @var DECIMAL(4,3);
DECLARE @alpha DECIMAL(4,2);
--Initial values
SET @theta0 = 0;
SET @theta1 = 1;
SET @theta0_t = 1;
SET @theta1_t = 0;
SET @alpha = 0.1;
SET @var = 0.01;
Step 2: Calculating values of Hθ and updated values of θ
--Calculating theta0
SELECT
 @theta0_t = @theta0 - (SUM(Outp)/(SELECT COUNT(*) FROM base))*@alpha
FROM
 (
 SELECT
  (@theta1*X + @theta0) - Y as Outp
 FROM base
 );--Calculating theta1
SELECT
 @theta1_t = @theta1 - (SUM(Outp)/(SELECT COUNT(*) FROM base))*@alpha
FROM
 (
 SELECT
  ((@theta1*X + @theta0) - Y)*X as Outp
 FROM base
 );
Step 3: Comparing if the updated values of θ are close to original θ or not
--Comparing thetas
IF (@theta0_t BETWEEN @theta0-@var AND @theta0+@var) AND (@theta1_t BETWEEN @theta1-@var AND @theta1+@var)
If the above condition is true, then we stop the process and finalize the values of θ. Otherwise, we keep repeating steps 2 & 3. Thus steps 2 & 3 need to be put inside a loop that runs as long as the updated and current values of θ are different.
WHILE (@theta0_t NOT BETWEEN @theta0-@var AND @theta0+@var) AND (@theta1_t NOT BETWEEN @theta1-@var AND @theta1+@var)
BEGIN
–Calculating theta0
SELECT
@theta0_t = @theta0 – (SUM(Outp)/(SELECT COUNT(*) FROM base))*@alpha
FROM
(
SELECT
(@theta1*X + @theta0) – Y as Outp
FROM base
);
	--Calculating theta1
	SELECT
		@theta1_t = @theta1 - (SUM(Outp)/(SELECT COUNT(*) FROM base))*@alpha
	FROM
		(
		SELECT
			((@theta1*X + @theta0) - Y)*X as Outp
		FROM base
		);

	--Comparing thetas
	IF (@theta0_t BETWEEN @theta0-@var AND @theta0+@var) AND (@theta1_t BETWEEN @theta1-@var AND @theta1+@var)
	BEGIN
		SELECT @theta0 = @theta0_t;
		SELECT @theta1 = @theta1_t;
		BREAK;
	END
	ELSE
	BEGIN
		SELECT @theta0 = @theta0_t;
		SELECT @theta1 = @theta1_t;
	END
END
The above loop will arrive at optimal values for θ. This is Gradient Descent in all it’s glory!
Step 4: Fill in the final values of θ in the hypothesis function to calculate predictions for the response variable
SELECT X,Y,@theta0+@theta1*X AS H_theta
FROM base
And that’s it! We’ve built a machine learning algorithm in SQL with just a few lines of code!
Practical applications & final thoughts
Despite the onset of technological advancements in the field of Data Science, more often than not, every Data Scientist ends up working with legacy systems. In such cases, if the size of the data is huge, it becomes impractical to fetch it out of a legacy system (like SQL Server) into another environment for data science purposes.
Although I initially began this project as a weekend DIY, I feel this has bigger implications. This can be polished and packaged much better to improve its usability. Things like splitting of data into test & train, turning this into multi-variate linear regression will make this project much more practical. I would also love to hear thoughts of all of you on what can be improved.
Thank you Ashish.
Keep Learning 🙂
The Data Monk
The Data Monk services
We are well known for our interview books and have 70+ e-book across Amazon and The Data Monk e-shop page . Following are best-seller combo packs and services that we are providing as of now
- YouTube channel covering all the interview-related important topics in SQL, Python, MS Excel, Machine Learning Algorithm, Statistics, and Direct Interview Questions
Link – The Data Monk Youtube Channel - Website – ~2000 completed solved Interview questions in SQL, Python, ML, and Case Study
Link – The Data Monk website - E-book shop – We have 70+ e-books available on our website and 3 bundles covering 2000+ solved interview questions. Do check it out
Link – The Data E-shop Page - Instagram Page – It covers only Most asked Questions and concepts (100+ posts). We have 100+ most asked interview topics explained in simple terms
Link – The Data Monk Instagram page - Mock Interviews/Career Guidance/Mentorship/Resume Making
Book a slot on Top Mate
The Data Monk e-books
We know that each domain requires a different type of preparation, so we have divided our books in the same way:
1. 2200 Interview Questions to become Full Stack Analytics Professional – 2200 Most Asked Interview Questions
2.Data Scientist and Machine Learning Engineer -> 23 e-books covering all the ML Algorithms Interview Questions
3. 30 Days Analytics Course – Most Asked Interview Questions from 30 crucial topics
You can check out all the other e-books on our e-shop page – Do not miss it
For any information related to courses or e-books, please send an email to nitinkamal132@gmail.com