We already know the assumptions of the Linear Regression. We will quickly go through the implementation part of the Linear Regression. We will be using R for this article(Read Sometimes, I am more comfortable in R 😛 )
Remember – The easiest part in any modeling project is to implement the model. The major pain point is cleaning the data, understanding important variables, and checking the performance of the model.
We will quickly go through the packages which you need, the functions and terminologies you need to understand in order to run a Linear Regression Model.
If you want to learn more about Linear Regression and ARIMA forecasting in R with 100 questions then you can try our book on Amazon ‘100 Linear Regression and ARIMA forecasting questions in R’
Packages in R
You don’t need any specific package to run the lm() function in R which is used to create a Linear Regression model.
Step 1 – Get your train and test dataset in a variable.
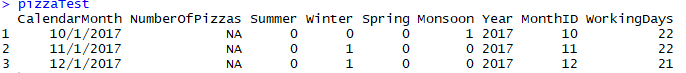
Remember – The name of columns and the number of columns in both the dataset should be same.
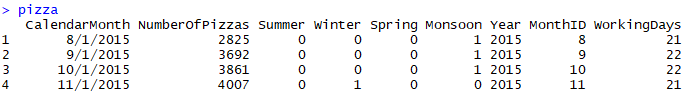
pizza <- read.csv(“C:\Users\User\Desktop\TDM Book\PaulPizza.csv”)
pizzaTest<- read.csv(“C:\Users\User\Desktop\TDM Book\PaulPizzaTest.csv”)
pizza contains the training dataset and pizza test contains the testing dataset
You can also do a multiple fold validation to randomly decide the training and test dataset. But we will try to keep it straight and simple. So, we have manually taken the training and testing dataset. We will not encourage you to do like this. Anyways, we have the training and testing dataset with ourself.
LinearModel <- lm(NumberOfPizzas ~ Spring+WorkingDays,
data = pizza)
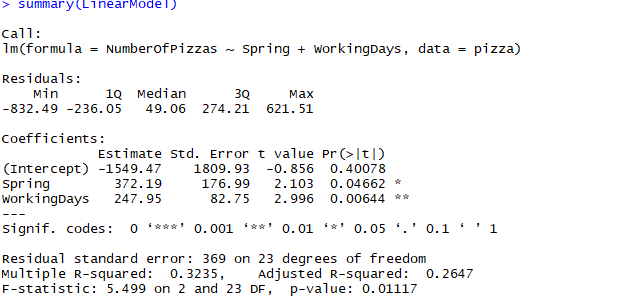
You are creating a LR model by the name of LinearModel. The function lm() takes the dependent variable and two independent variables i.e Spring and Working Days. The dataset is pizza i.e. the training dataset of the problem statement.
Let’s look into the summary to analyze the model
summary(LinearModel
What are the residuals?
In regression analysis, the difference between the observed value of the dependent variable (y) and the predicted value (ŷ) is called the residual (e). Each data point has one residual. Both the sum and the mean of the residuals are equal to zero.
What is coefficient-estimate?
It is the expected value of the number of pizzas which will be sold in a coming month, Since the accuracy of the model is too bad, the number is quite off. It shows that on an average 156691 pizzas is predicted to be sold. The second row shows the impact of each of the variable in this estimated calculation, this is called the slope term. For ex. The slope of Summer is 169.29, this suggests the effect that Summer has on the estimated value.
What is coefficient-standard error?
It suggests the average amount that the coefficient estimates vary from the actual value. The standard error can be used to compute and estimate of the expected difference.
What is coefficient-t value?
The t-value tells you how many Standard Deviation the coefficient is far away from 0. The more far it is, the easier it is to reject the null-hypothesis – i.e. we can declare a relationship between Y and x1,x2, etc.. In the above case only Working Days coefficient t-value is relatively far away from 0 which suggests a high correlation between number of pizzas sold and Working Days. This also helps us in understanding the p-value of that variable.
What should be the value of a good variable which we should include in our model?
A good variable for the model will have the following attributes:-
i. High Coefficient – t value
ii. Very low Pr(>|t|) value
What according to you is the most important variable in the model summary given above?
Looking at the t value and Pr value, Working Days seems to be the most relevant variable for the model
Now you need to use this model to predict the values for testing dataset which is stored in pizzatest
Function
pred_model <- predict(LinearModel,pizzaTest)
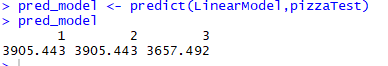
You can check the accuracy of the values by comparing it with the actual data for these three months.
There are more ways to check the performance of a Linear Regression model which we will discuss in the next article.
Linear Regression Part 1 – Assumptions and basics of LR
Linear Regression Part 3 – Evaluation of the model
Keep Learning 🙂
The Data Monk
The Data Monk services
We are well known for our interview books and have 70+ e-book across Amazon and The Data Monk e-shop page . Following are best-seller combo packs and services that we are providing as of now
- YouTube channel covering all the interview-related important topics in SQL, Python, MS Excel, Machine Learning Algorithm, Statistics, and Direct Interview Questions
Link – The Data Monk Youtube Channel - Website – ~2000 completed solved Interview questions in SQL, Python, ML, and Case Study
Link – The Data Monk website - E-book shop – We have 70+ e-books available on our website and 3 bundles covering 2000+ solved interview questions. Do check it out
Link – The Data E-shop Page - Instagram Page – It covers only Most asked Questions and concepts (100+ posts). We have 100+ most asked interview topics explained in simple terms
Link – The Data Monk Instagram page - Mock Interviews/Career Guidance/Mentorship/Resume Making
Book a slot on Top Mate
The Data Monk e-books
We know that each domain requires a different type of preparation, so we have divided our books in the same way:
1. 2200 Interview Questions to become Full Stack Analytics Professional – 2200 Most Asked Interview Questions
2.Data Scientist and Machine Learning Engineer -> 23 e-books covering all the ML Algorithms Interview Questions
3. 30 Days Analytics Course – Most Asked Interview Questions from 30 crucial topics
You can check out all the other e-books on our e-shop page – Do not miss it
For any information related to courses or e-books, please send an email to nitinkamal132@gmail.com