Hypothesis testing is one of the most important
There are
Here are the top 8 tests in statistics:-
1. Chi-Squared test
2. Student’s T-test
3. Analysis of Variance Test (ANOVA)
4. Pearson’s Correlation Coefficient
5. Kruskal-Wallis Test
6. Z-Test
7. Spearman’s Correlation Test
8. Wilcoxon’s Stratified Test
Why is hypothesis testing one of the most confusing and sometimes irritating things to learn?
We will try to keep things simple. You need to understand the things working in the background and what actually can you derive from a test result.
This session is
What is
There are lots of definition floating on the internet, but you need to understand the actual meaning of
A hypothesis is a claim. Suppose you are saying that the average age of people working in Aviator building is 26. Now you can not go and ask everyone about their age. But what you can do, is that you can pick a sample i.e. a group of people(unbiased obviously) and get their data.
Now your data says that the average age is 28. This is the claim from the sample and now you have to test this claim to see if it’s actually true.
The second most irritating question is, What is a null hypothesis?
Null Hypothesis is fairly simple to understand using
In the above
“The average age of people working in Aviator building is 26”
Null hypothesis takes up a current situation, if you want to challenge the null hypothesis, then you need to come up with an alternate hypothesis, something like this – “I am not sure if the average age is 26 because I feel nowadays experienced and laterals are hired too much. So, I will challenge the Null hypothesis”
Null Hypothesis – Average age is 26
Alternate Hypothesis – Things have chanegd and the average age is not 26. Let’s test and find the truth
How to write these down:-
Ho(H-knot) : Mean = 26Years
Ha(Alternate Hypothesis) : Mean != 26Years
Null and Alternative hypothesis is the mathematical opposite of each other.
Whenever you test something in statistics, there are only two possible outcomes:-
1. Reject the null hypothesis and confirms that the average age is anything but 26
2. Fail to reject the null hypothesis after all the tests and confirms that the average age is 26
Why can’t we directly prove that the average age is 26?
The Monk once said “If you can’t reject it, it means you accept it. It’s very hard to prove that you are true, so in order to prove that you are true, you need to prove that you are not false”. Thus we try to play around proving or disproving the “rejection of null hypothesis” and not proving the already proved Null hypothesis.
For example – If you want to prove that a beggar is actually poor. How will you proceed?
Your null hypothesis here will be that the beggar is poor.
Your alternate hypothesis will be that the beggar is not poor and you can prove it by showing his mobile bill or the latest iPhone he bought or his Blood red BMW parked right reside he begs. Prove at least one thing to disprove the already accepted fact that he is poor
Now, you take a sample of 100 employees and ask their age. You get an average age. But how to make sure that this sample represents the complete population? We use test statistics to answer the below point :
If the data you have is statistically significant enough to reject the null hypothesis.
Let’s continue with the same example. We took 5 people and sent them to different floors of the building asking 100 employees on each floor about their age. Below is the result accumulated by the 5 people about the average age:
1. Amit – 26.2 Years – Close enough to our Null hypothesis
2. Sahil – 27 Years – A bit far
3. Aman – 28 Years- Way far
4. Harish – 27.3 Years – Quite far
5. Rishabh – 29 Years- Very far
See, you got the result and you can say that everything is suggesting
You can’t directly reject a Null hypothesis if the average age of 50 people is 26.1 and your Null hypothesis is 26 😛
We need to check the confidence of your hypothesis, and here comes the term “level of confidence”
I am saying that I am 99% confident that I will pass the exam, that means you can trust me.
If I say I am 63% confident on passing the exam, then that is
In statistics, we mostly use 90%,95%, and 99% confidence interval i.e. 0.90,0.95, and 0.99
Level of significance(Alpha) = 1 – c
where c denotes a level of confidence and it falls in the range of 0 to 1
1. Chi-Square Test
A chi-square test helps in determining whether there is a significant difference between the observed and calculated frequencies in one or more categories.
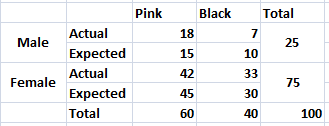
In order to calculate the expected value, do the following:-
(Column Total*Row Total)/Grand Total
Ex. (25*60)/100 = 15
(25*40)/100 = 10
Now you have both actual and expected value. To get the
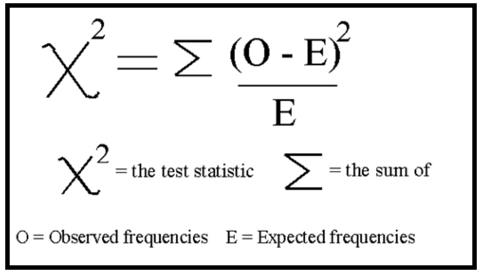
Now calculate the same for all the 4 cells.
You will get – 2.0 as the value of chi-square
To know the significance of the number, you also need to know one more term i.e. Degree of Freedom
The simple formula of
= (No. of columns – 1) * (No. of rows – 1)
Here the degree of freedom is 1 and the value of chi-square is 2.0. Have a look on the critical value of chi-square with respect to degree of freedom table
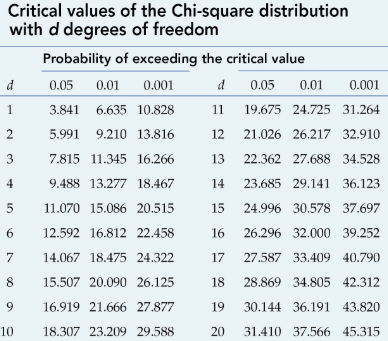
As we can see, for DoF 1, the critical value is 3.841 and we got 2.0. This means that the Null Hypothesis is true and gender has not much effect on the preferred color.
See, this is a very simple way of understanding
Keep Learning 🙂
XtraMous