Supervised Learning Data Science Questions. This is the third part of the series Supervised Learning Data Science Questions.
Part 1-https://thedatamonk.com/supervised-learning-interview-questions/
Part 2-https://thedatamonk.com/supervised-learning-interview-question/
Part 4-https://thedatamonk.com/supervised-learning-questions/
1. What is Logistic Regression?
Logistic Regression is a Machine Learning classification algorithm that is used to predict the probability of a categorical dependent variable. In logistic regression, the dependent variable is a binary variable that contains data coded as 1 (yes, success, etc.) or 0 (no, failure, etc.). In other words, the logistic regression model predicts P(Y=1) as a function of X.
What are the assumptions of Logistic Regression?
Binary logistic regression requires the dependent variable to be binary.
2. What are the types of questions that Logistic regression can examine?
How does the probability of getting lung cancer (yes vs. no) change for every additional pound a person is overweight and for every pack of cigarettes smoked per day?
Do body weight, calorie intake, fat intake, and age have an influence on the probability of having a heart attack (yes vs. no)?
3. What are the major assumptions in Logistic regression?
The dependent variable should be dichotomous in nature (e.g., presence vs. absent).
There should be no outliers in the data, which can be assessed by converting the continuous predictors to standardized scores, and removing values below -3.29 or greater than 3.29. There should be no high correlations (multicollinearity) among the predictors. This can be assessed by a correlation matrix among the predictors. Tabachnick and Fidell (2013) suggest that as long correlation coefficients among independent variables are less than 0.90 the assumption is met.
Most asked Supervised Learning Data Science Questions
4. What is over fitting?
When selecting the model for the logistic regression analysis, another important consideration is the model fit. Adding independent variables to a logistic regression model will always increase the amount of variance explained in the log odds (typically expressed as R²). However, adding more and more variables to the model can result in overfitting, which reduces the generalizability of the model beyond the data on which the model is fit.
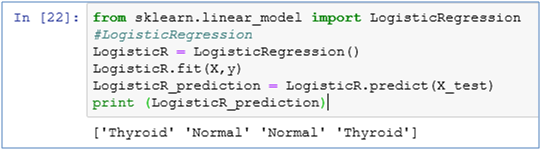
5. Let’s build a Logistic Regression Classifier
from sklearn.linear_model import LogisticRegression
#LogisticRegression
LogisticR = LogisticRegression()
LogisticR.fit(X,y)
LogisticR_prediction = LogisticR.predict(X_test)
print (LogisticR_prediction)
Let’s explore one more model i.e. Support Vector Classifier
6. What is Support Vector Classifier?
A Support Vector Machine (SVM) is a discriminative classifier formally defined by a separating hyperplane. In other words, given labeled training data (supervised learning), the algorithm outputs an optimal hyperplane which categorizes new examples. In two dimentional space this hyperplane is a line dividing a plane in two parts where in each class lay in either side.
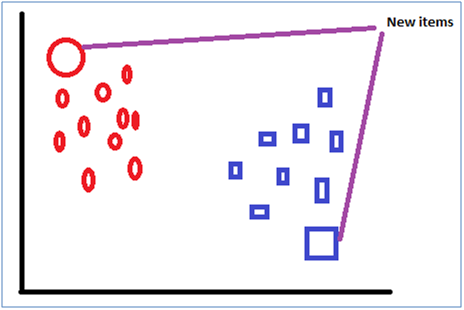
7. Give an example to explain SVM.
Let’s suppose we have a distribution of few items
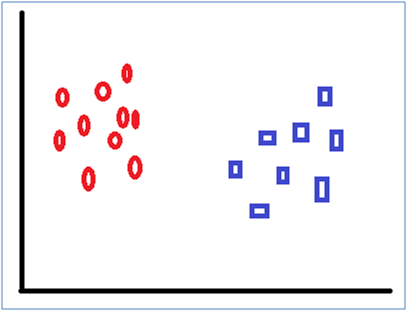
What an SVM does is that it makes a line of separation between the types of objects i.e. circle and rectangle. The attribute of test dataset is then examined on various parameters and are then placed in one of the two buckets like give below
8. What will happen if data points overlap, i.e. circles and rectangles are on the same point?
In a real-world application, finding the perfect class for millions of training data set takes a lot of time. As you will see in coding. This is called regularization parameter. In the next section, we define two terms regularization parameter and gamma. These are tuning parameters in SVM classifier. Varying those we can achieve considerable nonlinear classification line with more accuracy in a reasonable amount of time.
9. What is a kernel?
SVM algorithms use a set of mathematical functions that are defined as the kernel. The function of kernel is to take data as input and transform it into the required form.
For linear kernel the equation for prediction for a new input using the dot product between the input (x) and each support vector (xi) is calculated as follows:
f(x) = B(0) + sum(ai * (x,xi))
This is an equation that involves calculating the inner products of a new input vector (x) with all support vectors in training data. The coefficients B0 and ai (for each input) must be estimated from the training data by the learning algorithm.
10. What is the equation for polynomial kernel? Leave the question for now if you don’t want to go deep into Mathematics.
The polynomial kernel can be written as
K(x,xi) = 1 + sum(x * xi)^d
exponential as
K(x,xi) = exp(-gamma * sum((x — xi²))
11. What is Regularization?
The Regularization parameter (often termed as C parameter in python’s sklearn library) tells the SVM optimization how much you want to avoid misclassifying each training example.
12. What is the impact of a large and a small value of c?
For large values of C, the optimization will choose a smaller-margin hyper plane if that hyper plane does a better job of getting all the training points classified correctly. Conversely, a very small value of C will cause the optimizer to look for a larger-margin separating hyper plane, even if that hyper plane misclassifies more points.
13. What is Gamma?
The gamma parameter defines how far the influence of a single training example reaches, with low values meaning ‘far’ and high values meaning ‘close’. In other words, with low gamma, points far away from plausible separation line are considered in calculation for the separation line. Whereas high gamma means the points close to plausible line are considered in calculation.
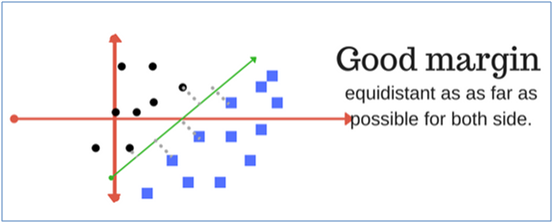
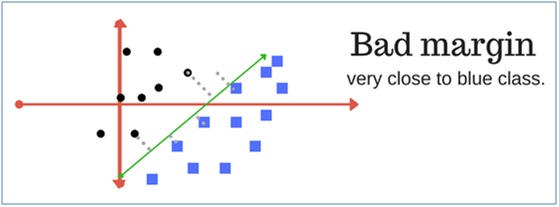
14. What is a margin?
A margin is a separation of line to the closest class points.
15. What is a good and a bad margin?
A good margin is one where this separation is larger for both the classes. Images below gives to visual example of good and bad margin. A good margin allows the points to be in their respective classes without crossing to other class.
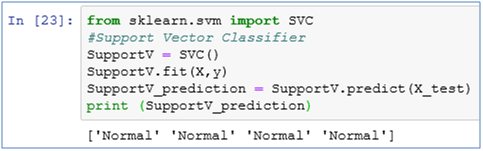
16. Let’s build the Support Vector Classifier model on our dataset
from sklearn.svm import SVC
#Support Vector Classifier
SupportV = SVC()
SupportV.fit(X,y)
SupportV_prediction = SupportV.predict(X_test)
print (SupportV_prediction)
17. How to measure the accuracy of models ?
We can use the accuracy_score() function which takes two parameters which are prediction values and real output i.e. y_test. These are present in the following packages
import numpy as np
from sklearn.metrics import accuracy_score
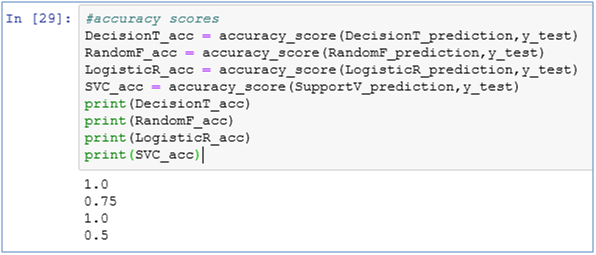
18. Print the accuracy of each model
DecisionT_acc = accuracy_score(DecisionT_prediction,y_test)
RandomF_acc = accuracy_score(RandomF_prediction,y_test)
LogisticR_acc = accuracy_score(LogisticR_prediction,y_test)
SVC_acc = accuracy_score(SupportV_prediction,y_test)
print(DecisionT_acc)
print(RandomF_acc)
print(LogisticR_acc)
print(SVC_acc)
K-Nearest Neighbor is one such algorithm which is very useful in classification problem. It is a very basic algorithm which gives a good accuracy.
19. What is KNN Algorithm?
The intuition behind the KNN algorithm is one of the simplest of all the supervised machine learning algorithms. It simply calculates the distance of a new data point to all other training data points. The distance can be of any type e.g Euclidean or Manhattan etc. It then selects the K-nearest data points, where K can be any integer. Finally it assigns the data point to the class to which the majority of the K data points belong.
20. What are the pros of KNN model?
a. It is extremely easy to implement
b. The KNN algorithm much faster than other algorithms that require training e.g. SVM, linear regression, etc.
c. Since the algorithm requires no training before making predictions, new data can be added seamlessly.
d. There are only two parameters required to implement KNN i.e. the value of K and the distance function (e.g. Euclidean or Manhattan etc.)
21. What are the cons of KNN model?
a. The KNN algorithm doesn’t work well with high dimensional data because with large number of dimensions, it becomes difficult for the algorithm to calculate distance in each dimension
b. The KNN algorithm has a high prediction cost for large datasets. This is because in large datasets the cost of calculating distance between new point and each existing point becomes higher
c. Finally, the KNN algorithm doesn’t work well with categorical features since it is difficult to find the distance between dimensions with categorical features
Try to solve these questions, other members will evaluate your answer and provide sufficient support.

inMobi- https://thedatamonk.com/inmobi-data-science-interview-question/
HSBC– https://thedatamonk.com/hsbc-business-analyst-interview-questions/
OLA– https://thedatamonk.com/ola-data-analyst-interview/
Big Basket- https://thedatamonk.com/big-basket-data-analyst-interview-questions/
Swiggy – https://thedatamonk.com/swiggy-data-analyst-interview-questions/
Accenture – https://thedatamonk.com/accenture-business-analyst-interview-question/
Deloitte – https://thedatamonk.com/deloitte-data-scientist-interview-questions/
Amazon – https://thedatamonk.com/amazon-data-science-interview-questions/
Myntra – https://thedatamonk.com/myntra-data-science-interview-questions-2/
Flipkart – https://thedatamonk.com/flipkart-business-analyst-interview-questions/
SAP – https://thedatamonk.com/sap-data-science-interview-questions/
BOX8 – https://thedatamonk.com/box8-data-analyst-interview-questions-2/
Zomato – https://thedatamonk.com/zomato-data-science-interview-questions/
Oracle – https://thedatamonk.com/oracle-data-analyst-interview-questions/
We will create the KNN model in the next post.
Keep Learning 🙂
XtraMous