Data Science is a combination of Statistics and Technology. In this article, we will try to understand some basic terminologies in Layman’s language.
Suppose I run a chain of Pizza outlets across Bangalore and have around 500 delivery boys. We have assured “less than 30 minutes delivery time” to our customers, but while going through the feedback forms, We can feel that the delivery executives are taking more than the promised time.
NULL hypothesis – The delivery time is less than 30 minutes. It is represented by Ho
Alternate Hypothesis – The delivery time is not less than 30 minutes or it is more than 30 minutes. It is represented as Ha.
We mostly try to test the Null hypothesis and see whether it’s true.
Population – Your total population is 500, which is the number of delivery boys
Sample – It’s not feasible to test the delivery time of each delivery boy, so we randomly take a small fragment of the population which is termed as Sample
You must have heard the term that a ‘p-value of 0.05 is good’, but what does that actually mean?
p-value helps you in determining the significance of your result in a hypothesis test. So, when you say that the p-value of the test is less than 0.05 then you sound like “There is strong evidence against your Null Hypothesis and you can reject it”
Similarly, when the p-value is significantly more than 0.05 then the Null Hypothesis stays strong as there is weak evidence against the Null Hypothesis.
In a layman’s term, if the hypothesis testing results in p-value less than 0.05 for the case mentioned above then we will be rejecting the null hypothesis by saying that the average amount of time to deliver a pizza is more than 30 minutes.
You must have got a fair bit of idea about population, sample, null hypothesis, alternate hypothesis, and p-value.
Let’s get back to sampling. There are four methods to get a segment out of a population i.e. sampling of a population:-
a. Random Sampling – Completely random selection
b. Systematic Sampling – A systematic way to sample a population, like taking the kth record from the population
c. Stratified Sampling – Suppose the complete population is divided into multiple groups, so stratified sampling will take a sample from each group. This reduces the biasness of the sample.
If we have a data set of people of different age group then a random sample might be biased towards a particular group. But, stratified sampling takes care of this
d. Cluster – When a population is divided into different clusters then we need to get an equal sample from each of these
We have the data set i.e. the population and we have taken a sample from it.
Now, we need to know the spread of the sample or the population.
I assume that you already know about mean, median, mode, etc.
The measure of spread describes how similar or varied a set of observed values are for a variable. The measure of spread includes:-
a. Standard Deviation
b. Variance
c. Range
d. Inter Quartile Range
e. Quartile
You can easily find a copy-book definition on the internet. Let’s try to understand it in simple terms.
Mean gives you an idea of average of the data.
Suppose the average salary of 5000 the employees at Walmart is $100,000.
The variance will give you an idea about the spread of the salary i.e. how far is your data point from the mean. We calculate Variance on either the complete population or the sample population.
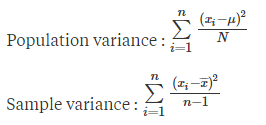
Both the formulas are almost the same, the only difference is the denominator. If you just want to memorize the formulas then also it’s fine. But, to understand the denominator, you need to go through the concept of degree of freedom. Let’s try
Degree of freedom is nothing but the number of observations in the data that are free to vary when estimating a parameter. In simple words, if you know the mean or average of 5 numbers, then all you need to know is 4 numbers and you can easily get the 5th number. Here the degree of freedom is n-1 i.e. 4. This is an example of the degree of freedom.
Now the reason why Population variance has N and Sample variance has N-1 as the denominator?
When we have a population size of 1000 and we have to calculate Population variance then we already know the mean of the Population, thus we divide it with N.
Read this loud – When we only know the mean of the sample, then we divide the value with N-1 to “compensate on the fact that we don’t have concrete information about the population, thus we try to keep the overall value larger by dividing it with N-1”
Quartile is a number and not a group of values. It’s more like a cut-off value. You have 3 quartiles in statistics
Quartile 1 – Also called 25th percentile. This is the middle number between the smallest number and the median of the data set.
Quartile 2 – Also called the median and the 50th percentile
Quartile 3 – Also called the 75th percentile and upper quartile. This is the middle value between the median and the highest value of the data set
To find the quartiles of this data set, use the following steps:
- Order the data from least to greatest.
- Find the median of the data set and divide the data set into two halves.
- Find the median of the two halves.
Interquartile Range = Q3-Q1
It is the midspread or the middle 50 percentile of the dataset. It’s also value and not a group of numbers
Bonus knowledge
How to identify an outlier?
A basic rule is that whenever a data point is more than 1.5 times of the third quartile or less than 1.5 times of the first quartile, then it’s termed as an outlier.
Ek example dekh lo, samjh aa jaeyga
Numbers – 2,4,5,7,9,11,13
Median = 4th term as we have 7 terms and the numbers are arranged in ascending order. Thus median(Q2) is 7
Quartile 1(Q1) = Median of the dataset containing the lower half of the data i.e. calculate the median of 2,4,5. Thus Q1 will be the 2nd term i.e. 4
Quartile 3(Q3) = Median of the upper half of the data i.e. median of 9,11,13. Thus median is 11
(2,4,5),7,(9,11,13) ~ (Q1),Q2,(Q3)
Inter Quartile Range = Q3-Q1 = 11-4 = 7
Keep Learning
The Data Monk
The Data Monk services
We are well known for our interview books and have 70+ e-book across Amazon and The Data Monk e-shop page . Following are best-seller combo packs and services that we are providing as of now
- YouTube channel covering all the interview-related important topics in SQL, Python, MS Excel, Machine Learning Algorithm, Statistics, and Direct Interview Questions
Link – The Data Monk Youtube Channel - Website – ~2000 completed solved Interview questions in SQL, Python, ML, and Case Study
Link – The Data Monk website - E-book shop – We have 70+ e-books available on our website and 3 bundles covering 2000+ solved interview questions. Do check it out
Link – The Data E-shop Page - Instagram Page – It covers only Most asked Questions and concepts (100+ posts). We have 100+ most asked interview topics explained in simple terms
Link – The Data Monk Instagram page - Mock Interviews/Career Guidance/Mentorship/Resume Making
Book a slot on Top Mate
The Data Monk e-books
We know that each domain requires a different type of preparation, so we have divided our books in the same way:
1. 2200 Interview Questions to become Full Stack Analytics Professional – 2200 Most Asked Interview Questions
2.Data Scientist and Machine Learning Engineer -> 23 e-books covering all the ML Algorithms Interview Questions
3. 30 Days Analytics Course – Most Asked Interview Questions from 30 crucial topics
You can check out all the other e-books on our e-shop page – Do not miss it
For any information related to courses or e-books, please send an email to nitinkamal132@gmail.com