The Atlassian interview process comprises various stages, starting with an initial phone screening and progressing through technical assessments, coding challenges, and multiple rounds of in-person or virtual interviews. These interviews encompass a mix of technical inquiries, behavioral assessments, and interactive discussions with potential team members or managers. Reflecting Atlassian’s emphasis on collaboration, the process may involve group activities or presentations to gauge candidates’ teamwork skills. Adequate preparation for both technical and behavioral questions is crucial, along with showcasing a solid understanding of Atlassian’s products and core values.
At Atlassian, proficiency in SQL is essential for extracting and analyzing user behavior data to improve software tools and for managing databases to ensure efficient retrieval and updating of product information. Consequently, SQL-related questions are a common feature in interviews for Data Science, Data Engineering, and Data Analytics positions at Atlassian.
If you’re preparing for a SQL interview, here are few Atlassian SQL interview questions for you to practice

Questions
- Provide an example of ticket closure and outline the steps involved in conducting hypothesis testing for the given scenario.
- What strategies would you employ to enhance the efficiency of the ticket closure process?
- How would you address a situation where collaboration and support from colleagues and managers are lacking in your work environment?
SQL Questions
1. Why is the UNIQUE constraint used in SQL?.
Answer:
The UNIQUE constraint in SQL serves the crucial function of ensuring that all values within a specified column are distinct. This constraint is commonly utilized in conjunction with other constraints, such as NOT NULL, to impose specific rules on the data.
For instance, let’s consider a scenario in a university database where student information is stored:
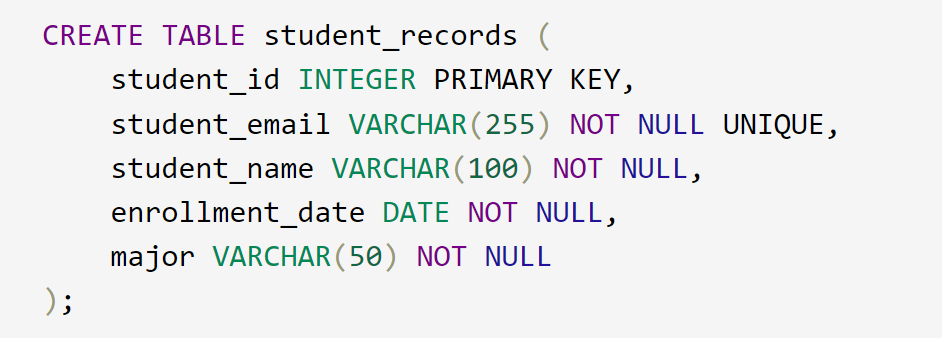
In this example, the UNIQUE constraint is applied to the “student_email” field to guarantee that each student’s email address is unique. This helps maintain data integrity within the student_records table, preventing the possibility of having two students with the same email address. The UNIQUE constraint acts as a safeguard against potential errors and duplicates in the dataset, ensuring the reliability of the information stored.
2. Explain the concept of a database index and provide examples of various index types.
Answer: A database index is employed to enhance database performance by reducing the search scope required to retrieve a record.
There exist different types of indexes within a database:
- Primary Index: Utilizes a unique identifier for direct row access.
- Unique Index: Enforces uniqueness for the indexed columns in a table.
- Composite Index: Established on multiple columns, expediting searches across various columns.
- Clustered Index: Dictates the physical data order within a table.
3. Scenario: Calculate the Average Processing Time for Orders Across Regions
Imagine a scenario where a company manages orders across various regions using a database with two tables: regions and orders. The regions table contains information about different regions and their region_id, while the orders table includes details such as order_id, the region in which it was processed, and the timestamps for order creation and fulfillment.
Objective: Write a SQL query to determine the average processing time for orders in each region.
regions Example Input:
| region_id | region_name |
|---|---|
| 1 | North Region |
| 2 | South Region |
| 3 | East Region |
orders Example Input:
| order_id | region_id | created_at | fulfilled_at |
|---|---|---|---|
| 1 | 1 | 2021-07-05 08:00:00 | 2021-07-07 12:00:00 |
| 2 | 1 | 2021-07-06 10:00:00 | 2021-07-08 14:00:00 |
| 3 | 2 | 2021-07-07 12:00:00 | 2021-07-09 16:00:00 |
| 4 | 2 | 2021-07-08 14:00:00 | 2021-07-10 18:00:00 |
| 5 | 3 | 2021-07-09 16:00:00 | 2021-07-11 20:00:00 |
Answer: A SQL query can be formulated to join the two tables on region_id, calculate the time difference between fulfilled_at and created_at for each order, and then group by region_id to compute the average processing time.
Here’s a potential PostgreSQL query:
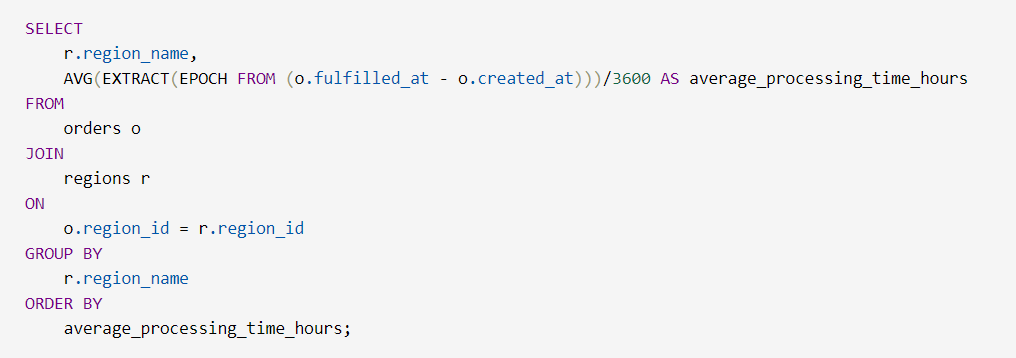
This query adapts the previous example to calculate the average processing time for orders in each region, with the output providing a list of regions and their corresponding average processing time in hours. Adjust the divisor as needed for different time units.
4. Scenario: Monthly Average User Engagement
Imagine Atlassian is keen on understanding user engagement across its products, Jira and Confluence. For this analysis, a database table named user_activity_logs is used, documenting entries whenever a user interacts with either product. The table comprises columns for log_id (a unique identifier), user_id (identifying the user), product (indicating the tool used – ‘Jira’ or ‘Confluence’), timestamp (the date and time of the activity), and duration (the time spent on the activity in minutes).
Objective: Construct a SQL query to determine the average user engagement duration for each product on a monthly basis for the year 2022.
user_activity_logs Example Input:
| log_id | user_id | product | timestamp | duration |
|---|---|---|---|---|
| 1001 | 101 | Jira | 01/05/2022 09:30:00 | 25 |
| 1002 | 102 | Confluence | 02/10/2022 12:45:00 | 40 |
| 1003 | 103 | Jira | 03/15/2022 14:00:00 | 20 |
| 1004 | 104 | Confluence | 04/20/2022 10:00:00 | 30 |
| 1005 | 105 | Jira | 05/25/2022 16:30:00 | 35 |
| 1006 | 106 | Confluence | 06/30/2022 11:00:00 | 15 |
| 1007 | 107 | Jira | 07/05/2022 13:45:00 | 18 |
| 1008 | 108 | Confluence | 08/12/2022 10:30:00 | 28 |
Example Output Table:
| month | product | avg_duration |
|---|---|---|
| 1 | Jira | 25.00 |
| 2 | Confluence | 40.00 |
| 3 | Jira | 20.00 |
| 4 | Confluence | 30.00 |
| 5 | Jira | 35.00 |
| 6 | Confluence | 15.00 |
| 7 | Jira | 18.00 |
| 8 | Confluence | 28.00 |
Answer: To determine the average user engagement duration for each product monthly in the year 2022, a SQL query can be crafted as follows:
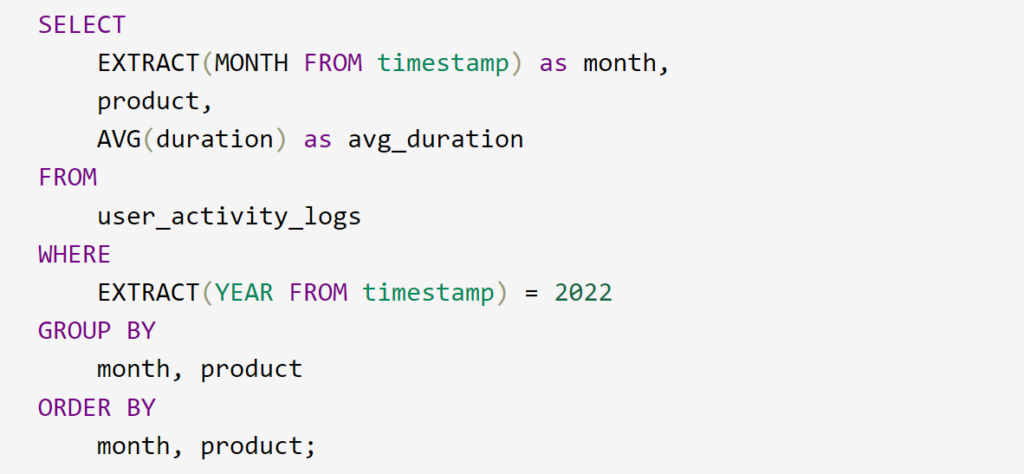
This query filters activities from the year 2022, groups the data by the month and product, and calculates the average duration for each group. The final result is ordered by month and then product. Adjust column names and specifics based on the structure of your user_activity_logs table.
5. Scenario: Determining Most Frequently Used Software Tools
Imagine you have a database that tracks user interactions with various software tools provided by Atlassian. Your goal is to identify the software tool that was most frequently used over the last month.
To achieve this, you have a ‘User’ table storing user data and a ‘Usage’ table recording instances of users interacting with the software tools.
users Sample Input:
| user_id | user_name |
|---|---|
| 101 | Alice |
| 102 | Bob |
| 103 | Carol |
| 104 | David |
usage Sample Input:
| usage_id | user_id | product_name | date |
|---|---|---|---|
| 1 | 101 | Jira | 07/22/2022 |
| 2 | 102 | Jira | 07/15/2022 |
| 3 | 101 | Confluence | 07/02/2022 |
| 4 | 103 | Bitbucket | 07/15/2022 |
| 5 | 104 | Trello | 07/25/2022 |
| 6 | 103 | Bitbucket | 07/30/2022 |
| 7 | 101 | Jira | 07/19/2022 |
| 8 | 102 | Jira | 07/15/2022 |
| 9 | 103 | Bitbucket | 07/15/2022 |
| 10 | 101 | Confluence | 07/23/2022 |
Task: Write a query to retrieve the name of the software tool that was most frequently used in the last month and provide the total number of usages.
Answer:
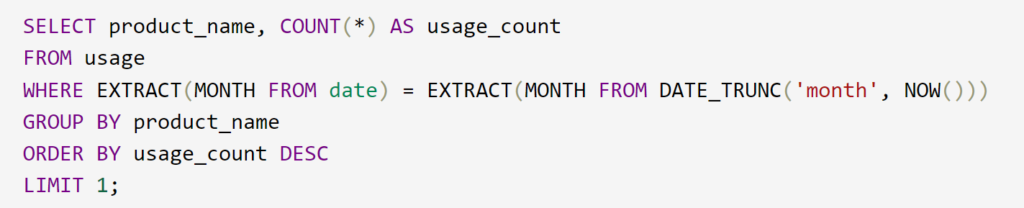
This query groups records in the ‘usage’ table by ‘product_name’, counts occurrences for each group, and limits the result to the tool with the highest count. The WHERE clause ensures only records from the current month are considered. The EXTRACT function retrieves the month part of the date in PostgreSQL, and DATE_TRUNC returns the first day of the current month. If there are ties for the most frequent usage, this query will return one of them. If you want all usages in case of ties, you can remove the LIMIT clause.
6. Scenario: Analyzing Issue Resolution Duration
Imagine you’re tasked with analyzing issue resolution patterns for projects at Atlassian, a software development company that extensively uses issue tracking systems like Jira. Your objective is to determine the average duration in days it takes to resolve issues for each project.
issues Sample Input:
| issue_id | project_id | status | reported_date | resolved_date |
|---|---|---|---|---|
| 201 | 987 | resolved | 03/12/2022 | 04/05/2022 |
| 302 | 654 | resolved | 04/15/2022 | 05/10/2022 |
| 453 | 987 | open | 05/20/2022 | null |
| 604 | 321 | resolved | 07/01/2022 | 07/25/2022 |
| 705 | 654 | resolved | 08/10/2022 | 08/28/2022 |
| 806 | 321 | resolved | 09/05/2022 | 10/02/2022 |
Example Output Table:
| project_id | avg_duration |
|---|---|
| 987 | 24.50 |
| 654 | 18.50 |
| 321 | 19.00 |
Task: Write a query to calculate the average duration in days it takes to resolve issues for each project.
Answer:
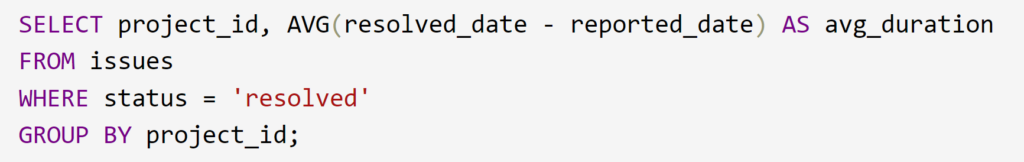
In this query, we first filter issues by their resolution status, excluding those that aren’t resolved. The subtraction of reported date from resolved date calculates the duration it took to resolve each issue. The results are then grouped by project_id, and the AVG function computes the average duration for each project. The final output provides insight into the average resolution time for issues in different projects. Adjust the column names and specifics based on the structure of your actual dataset.
7. Scenario: Analyzing Monthly Sales per Product
In your role as a data analyst at Atlassian, you’re tasked with determining the average monthly sales per product to gain insights into product performance. This involves grouping the data by both month and product and calculating the average sales using the AVG function.
sales Sample Input:
| sale_id | product_id | sale_date | unit_price | quantity |
|---|---|---|---|---|
| 101 | Jira | 08/05/2022 12:00:00 | 120 | 4 |
| 102 | Confluence | 08/10/2022 14:30:00 | 180 | 3 |
| 103 | Bitbucket | 08/18/2022 11:45:00 | 40 | 8 |
| 104 | Jira | 09/12/2022 10:00:00 | 110 | 6 |
| 105 | Bitbucket | 09/22/2022 09:15:00 | 45 | 5 |
Example Output Table:
| month | product | avg_sales |
|---|---|---|
| 8 | Jira | 480 |
| 8 | Confluence | 540 |
| 8 | Bitbucket | 320 |
| 9 | Jira | 660 |
| 9 | Bitbucket | 225 |
Task: Write a query to calculate the average monthly sales per product.
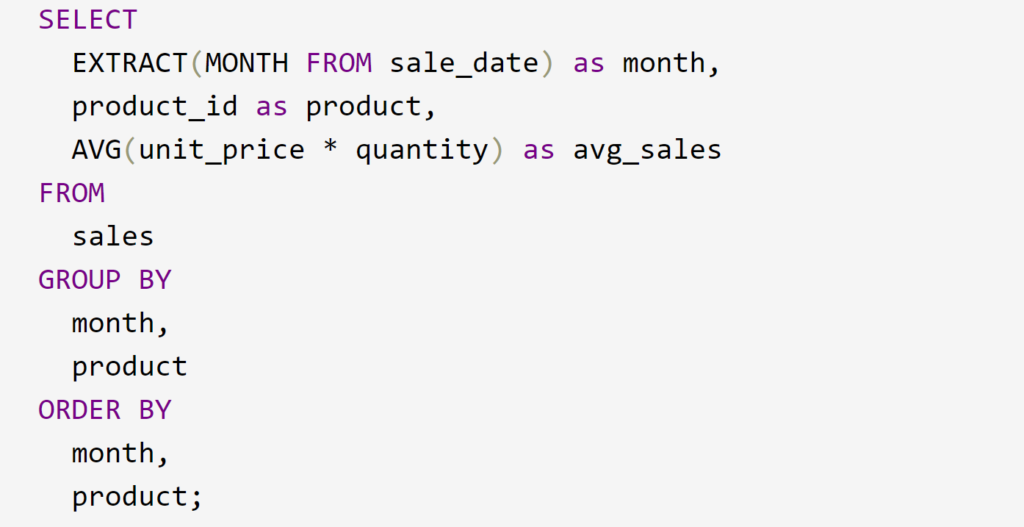
This query first extracts the month from each sale date using the EXTRACT function. It then groups the data by month and product_id and calculates the average sales for each group using the AVG function. The ORDER BY clause ensures the results are ordered first by month and then by product for better readability. Adjust column names and specifics based on the structure of your actual dataset.
8. Scenario: Distinctive Features of Cross Join and Natural Join
In the realm of SQL JOIN operations, both cross join and natural join serve unique purposes. A cross join, also known as a cartesian join, combines every row from one table with every row from another, creating a new table. Conversely, a natural join merges rows from two or more tables based on shared columns, reflecting a natural relationship.
Example of Cross Join: Suppose you’re part of the Marketing Analytics team at <company_name>, tasked with correlating advertising copy and creative images. A cross join between the ad_copy and ad_creative tables could look like this:
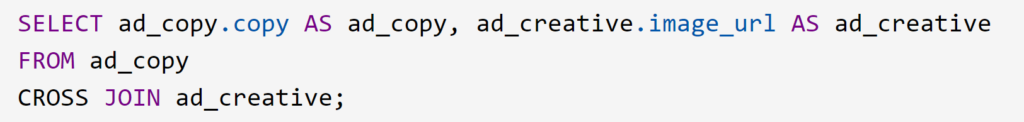
This query generates combinations of each ad copy with every ad creative, producing a comprehensive set of possibilities.
Example of Natural Join: Consider sales data exported from Atlassian’s Salesforce CRM stored in a data warehouse with tables for sales and atlassian_customers. An INNER JOIN, a type of natural join, could link these tables based on the common customer_id field:
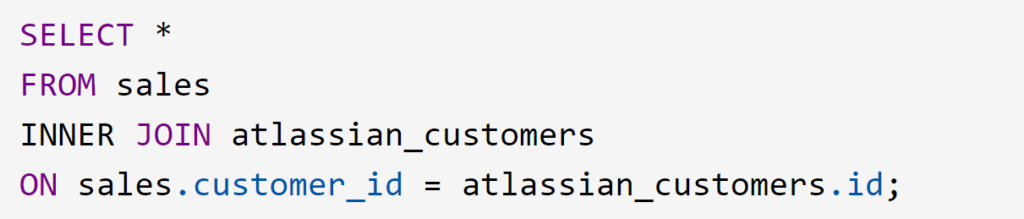
This query retrieves matching rows from both tables, using the shared customer_id as the linkage. Notably, natural joins necessitate common columns for merging.
Key Differences:
- Common Columns Requirement:
- Cross Join: Does not require any common columns between the tables being joined.
- Natural Join: Requires shared columns for merging.
- Resultant Table Size:
- Cross Join: Can create large tables, especially if the input tables have a substantial number of rows.
- Natural Join: Returns a table with rows equal to the number of matching rows in the input tables.
These differences underscore the distinct characteristics and use cases of cross joins and natural joins in SQL. Adjustments to the examples can be made based on your actual dataset structure and requirements.
9. Scenario: Customer and Product Analysis
In the realm of customer and product analysis, you have two tables – customers and products. The customers table contains customer_id, region, and signup_time, while the products table holds product_id, customer_id, and purchase_time. Your task is to craft a SQL query to identify the count of customers from each region who made their first purchase within one month of signing up.
customers Example Input:
| customer_id | region | signup_time |
|---|---|---|
| 101 | APAC | 2022-01-03 00:00:00 |
| 102 | AMER | 2022-02-08 00:00:00 |
| 103 | EMEA | 2022-03-12 00:00:00 |
| 104 | AMER | 2022-04-18 00:00:00 |
| 105 | APAC | 2022-05-25 00:00:00 |
products Example Input:
| product_id | customer_id | purchase_time |
|---|---|---|
| 1001 | 101 | 2022-01-25 00:00:00 |
| 2002 | 102 | 2022-03-10 00:00:00 |
| 3003 | 103 | 2022-03-20 00:00:00 |
| 4004 | 104 | 2022-04-05 00:00:00 |
| 5005 | 102 | 2022-04-10 00:00:00 |
Task: Compose a SQL query to determine the count of customers from each region who made their first purchase within one month of signing up.
Answer:
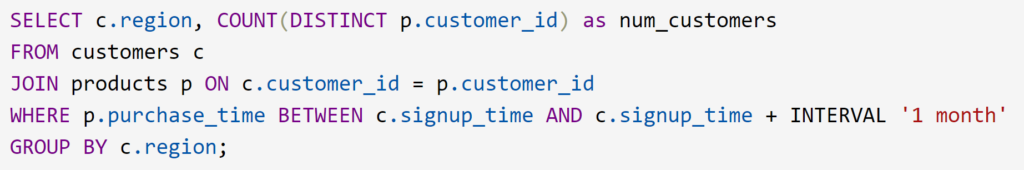
This query combines the customers and products tables based on customer_id, filtering rows where the purchase_time falls within one month of the signup_time. The data is then grouped by region, and the count of distinct customer_ids is calculated for each region. This provides insights into the number of customers from each region who made their initial purchase within the first month of signing up. Adjust the column names and specifics based on your actual dataset structure.
Behavioral Questions:
- Describe a significant challenge you’ve faced in your life and discuss how you successfully navigated through it.
- In what ways do you believe your personal values resonate with the culture at Atlassian?
- Share an instance when you successfully managed a workplace conflict.
- Describe a situation in which you anticipated potentially missing a deadline. How did you handle and resolve the challenge?
The Data Monk services
We are well known for our interview books and have 70+ e-book across Amazon and The Data Monk e-shop page . Following are best-seller combo packs and services that we are providing as of now
- YouTube channel covering all the interview-related important topics in SQL, Python, MS Excel, Machine Learning Algorithm, Statistics, and Direct Interview Questions
Link – The Data Monk Youtube Channel - Website – ~2000 completed solved Interview questions in SQL, Python, ML, and Case Study
Link – The Data Monk website - E-book shop – We have 70+ e-books available on our website and 3 bundles covering 2000+ solved interview questions. Do check it out
Link – The Data E-shop Page - Instagram Page – It covers only Most asked Questions and concepts (100+ posts). We have 100+ most asked interview topics explained in simple terms
Link – The Data Monk Instagram page - Mock Interviews/Career Guidance/Mentorship/Resume Making
Book a slot on Top Mate
The Data Monk e-books
We know that each domain requires a different type of preparation, so we have divided our books in the same way:
1. 2200 Interview Questions to become Full Stack Analytics Professional – 2200 Most Asked Interview Questions
2.Data Scientist and Machine Learning Engineer -> 23 e-books covering all the ML Algorithms Interview Questions
3. 30 Days Analytics Course – Most Asked Interview Questions from 30 crucial topics
You can check out all the other e-books on our e-shop page – Do not miss it
For any information related to courses or e-books, please send an email to nitinkamal132@gmail.com