To understand the performance of a model you need to start with Confusion matrix. If you have escaped it below, then you can go through it again.
A confusion matrix is a summary of prediction results on a classification problem.
The number of correct and incorrect predictions are summarized with count values and broken down by each class. This is the key to the confusion matrix.
The confusion matrix shows the ways in which your classification model
is confused when it makes predictions.
It gives you insight not only into the errors being made by your classifier but more importantly the types of errors that are being made.
It is this breakdown that overcomes the limitation of using classification accuracy alone.
In a two-class problem, we are often looking to discriminate between observations with a specific outcome, from normal observations.
Such as a disease state or event from no disease state or no event.
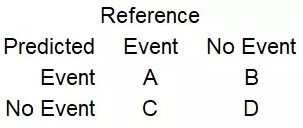
In this way, we can assign the event row as “positive” and the no-event row as “negative“. We can then assign the event column of predictions as “true” and the no-event as “false“.
This gives us:
- “true positive” for correctly predicted event values.
- “false positive” for incorrectly predicted event values.
- “true negative” for correctly predicted no-event values.
- “false negative” for incorrectly predicted no-event values.
A confusion matrix is typically computed in any machine learning classifier such us logistic regression, decision tree, support vector machine, naive bayes etc. to calculate a cross-tabulation of observed (true) and predicted classes (model). There are several metrics such as precision and recall that helps us interpret the accuracy of the model and choose the best model.
Sensitivity = A/(A+C)
Specificity = D/(B+D)
Prevalence = (A+C)/(A+B+C+D)
Positive Predicted Value (PPV) =
(sensitivity * prevalence)/((sensitivity*prevalence) + ((1-specificity)*(1-prevalence)))
Negative Predicted Value (NPV) =
(specificity * (1-prevalence))/(((1-sensitivity)*prevalence) + ((specificity)*(1-prevalence)))
Detection Rate = A/(A+B+C+D)
Detection Prevalence = (A+B)/(A+B+C+D)
Balanced Accuracy = (sensitivity+specificity)/2
Precision = A/(A+B)
Recall = A/(A+C)
We are using the Thyroid example to understand how this confusion matrix is important to us. Suppose our test data set has 100 rows and the values in the Confusion matrix are
true positive – 45
false positive – 5
true negative– 5
false negative – 45
So, the accuracy of your model will be (45+45)/(45+5+5+45) i.e. number of
correct prediction divided by total prediction which is 90%.
False positive shows that there were 5 people who did not have Thyroid but our model projected it as suffering from it.
This was a revision to the things which we have already discussed. There are four other ways to evaluate a model
1. Classification accuracy
2. Logarithmic Loss
3. Area under ROC curve
4. Classification report
1. Classification accuracy
Classification accuracy is the number of correct predictions made as a ratio of all predictions made.
This is the most common evaluation metric for classification problems, it is also the most misused. It is really only suitable when there are an equal number of observations in each class (which is rarely the case) and that all predictions and prediction errors are equally important, which is often not the case.
from sklearn import model_selection
seed = 143
kfold = model_selection.KFold(n_splits=5, random_state=seed)
model = LogisticRegression()
scoring = ‘accuracy’
results = model_selection.cross_val_score(model, X, Y, cv=kfold, scoring=scoring)
a. model is Logistic Regression
b. kfold value is set to 5 splits i.e. cross-validation of the result will be done on 5 partitions. We will learn more about cross validation later
c. scoring parameter is accuracy
2. Logarithmic Loss
Logarithmic loss (or logloss) is a performance metric for evaluating the predictions of probabilities of membership to a given class.
The scalar probability between 0 and 1 can be seen as a measure of confidence for a prediction by an algorithm. Predictions that are correct or incorrect are rewarded or punished proportionally to the confidence of the prediction.
from sklearn import model_selection
from sklearn.linear_model import LogisticRegression
seed = 143
kfold = model_selection.KFold(n_splits=5, random_state=seed)
model = LogisticRegression()
scoring = ‘neg_log_loss’
results = model_selection.cross_val_score(model, X, Y, cv=kfold, scoring=scoring)
3. Area Under ROC curve
Area under ROC Curve (or AUC for short) is a performance metric for binary classification problems.
The AUC represents a model’s ability to discriminate between positive and negative classes. An area of 1.0 represents a model that made all predictions perfectly. An area of 0.5 represents a model as good as random.
ROC can be broken down into sensitivity and specificity. A binary classification problem is really a trade-off between sensitivity and specificity.
- Sensitivity is the true positive rate also called the recall. It is the number instances from the positive (first) class that actually predicted correctly.
- Specificity is also called the true negative rate. Is the number of instances from the negative class (second) class that were actually predicted correctly.
from sklearn import model_selection
from sklearn.linear_model import LogisticRegression
seed = 143
kfold = model_selection.KFold(n_splits=5, random_state=seed)
model = LogisticRegression()
scoring = ‘roc_auc’
results = model_selection.cross_val_score(model, X, Y, cv=kfold, scoring=scoring)
4. Classification Report
Scikit-learn does provide a convenience report when working on classification problems to give you a quick idea of the accuracy of a model using a number of measures.
The classification_report() function displays the precision, recall, f1-score and support for each class.
from sklearn import model_selection
from sklearn.linear_model import LogisticRegression
from sklearn.metrics import classification_report
test_size = 0.33
seed = 7
X_train, X_test, Y_train, Y_test = model_selection.train_test_split(X, Y, test_size=test_size, random_state=seed)
model = LogisticRegression()
model.fit(X_train, Y_train)
predicted = model.predict(X_test)
report = classification_report(Y_test, predicted)
The codes are self-explanatory. For more explanation you can look for Wikipedia links. In case you have doubt in any part of the code, then don’t worry. We will deal with these in the upcoming days.
Keep Coding 🙂
XtraMous
The Data Monk services
We are well known for our interview books and have 70+ e-book across Amazon and The Data Monk e-shop page . Following are best-seller combo packs and services that we are providing as of now
- YouTube channel covering all the interview-related important topics in SQL, Python, MS Excel, Machine Learning Algorithm, Statistics, and Direct Interview Questions
Link – The Data Monk Youtube Channel - Website – ~2000 completed solved Interview questions in SQL, Python, ML, and Case Study
Link – The Data Monk website - E-book shop – We have 70+ e-books available on our website and 3 bundles covering 2000+ solved interview questions. Do check it out
Link – The Data E-shop Page - Instagram Page – It covers only Most asked Questions and concepts (100+ posts). We have 100+ most asked interview topics explained in simple terms
Link – The Data Monk Instagram page - Mock Interviews/Career Guidance/Mentorship/Resume Making
Book a slot on Top Mate
The Data Monk e-books
We know that each domain requires a different type of preparation, so we have divided our books in the same way:
1. 2200 Interview Questions to become Full Stack Analytics Professional – 2200 Most Asked Interview Questions
2.Data Scientist and Machine Learning Engineer -> 23 e-books covering all the ML Algorithms Interview Questions
3. 30 Days Analytics Course – Most Asked Interview Questions from 30 crucial topics
You can check out all the other e-books on our e-shop page – Do not miss it
For any information related to courses or e-books, please send an email to nitinkamal132@gmail.com