You always have to read and write files when working for a company or Hackathon. So, it’s necessary to know how to read different types of files.
Let’s start the boring but important part
The most important command to open a file in Python is the open() method. It takes two parameters, Name of the file and action mode.
Like most of the other programming languages, Python has 4 modes to access a file:- 1. “r” – Read – Reads a file 2. “a” – Append – Appends a file or create a new file 3. “w” – Write – Writes a new file 4. “x” – Create – Creates the specified file
Apart from these you can also specify the format in which you want to open the file: 1. t for Text(Default) 2. b for Binary file
Open a file x = open(“Analytics.txt”,”rt”) It opens the file, basically reads it in text format
Read the file
You can also read the file line by line by the following method or by using readline() method
Write something in a file
Delete a file
Use the “os” package and then run the remove() command import os os.remove(“file name”)
God forbid, if you ever have to delete a folder and want to look cool in front of your friends, you can use the following command
os.rmdir(“Name of directory”)
Reading CSV file Comma Separated Values or CSV file format is one of the most used file formats and you will definitely come across reading a csv file often. In order to read it, you should ideally import pandas library
There are a lot of file formats, but we covered only those which are of utmost important. In case you need more information, try this link from Data Camp or you can trust your best friend StackOverFlow 😛
If you need information about a specific file format, do comment below.
The reason why I put interview questions as the title of a lot of posts is because:– 1. It makes you click on the post 2. It makes you feel that these are very important questions and you can nail an interview with it 3. These are actual interview questions asked in companies like Myntra, Flipkart, BookMyShow, WNS, Sapient, etc. 4. You have to practice to become perfect. You can practice here or anywhere else. But make sure you know all the questions given below.
Toh surukartehainbinakisibakchodike Let’s start with the questions 😛
1. Which data type is mutable and ordered in Python? List
2. Can a dictionary contain another dictionary? Yes, a dictionary can contain another dictionary. In fact, this is the main advantage of using dictionary data type.
3. When to use list, set or dictionaries in Python? A list keeps order, dict and set don’t: When you care about order, therefore, you must use list (if your choice of containers is limited to these three, of course;-).
dict associates with each key a value, while list and set just contain values: very different use cases, obviously. set requires items to be hashable, list doesn’t: if you have non-hashable items, therefore, you cannot use set and must instead use list.
4.WAP where you first create an empty list and then add the elements. basic_list = [] basic_list.append(‘Alpha’) basic_list.append(‘Beta’) basic_list.append(‘Gamma’)
5. What does this mean: *args, **kwargs? And why would we use it? We use *args when we aren’t sure how many arguments are going to be passed to a function, or if we want to pass a stored list or tuple of arguments to a function. **kwargsis used when we don’t know how many keyword arguments will be passed to a function, or it can be used to pass the values of a dictionary as keyword arguments. The identifiers args and kwargs are a convention, you could also use *bob and **billy but that would not be wise.
6. What are negative indexes and why are they used? The sequences in Python are indexed and it consists of the positive as well as negative numbers. The numbers that are positive uses ‘0’ that is uses as first index and ‘1’ as the second index and the process goes on like that.
7. Randomly shuffle the content of a list
8. Take a random sample of 20 elements and put it in a list
9. Take a list and sort it
10. Explain split() and sub() function from the “re” package split() – uses a regex pattern to “split” a given string into a list sub() – finds all substrings where the regex pattern matches and then replace them with a different string
11. What are the supported data types in Python? The most important data types include the following: 1. Number 2. String 3. List 4.Tuple 5. Dictionary 6. Set
12. What is the function to reverse a list? list.reverse()
13. How to remove the last object from the list? list.pop(obj=list[-1]) Removes and returns last object or obj from list.
14. What is a dictionary? A dictionary is one of the built-in data types in Python. It defines an unordered mapping of unique keys to values. Dictionaries are indexed by keys, and the values can be any valid Python data type (even a user-defined class). Notably, dictionaries are mutable, which means they can be modified. A dictionary is created with curly braces and indexed using the square bracket notation.
15. Python is an object oriented language. What are the features of an object oriented programming language? OOP is the programming paradigm based on classes and instances of those classes called objects. The features of OOP are: Encapsulation, Data Abstraction, Inheritance, Polymorphism.
16. What is the difference between append() and extend() method? Both append() and extend() methods are the methods of list. These methods a re used to add the elements at the end of the list. append(element) – adds the given element at the end of the list which has called this method. extend(another-list) – adds the elements of another-list at the end of the list which is called the extend method.
17. Write a program to check if a string is a palindrome? Palindrome is a string which is symmetric like. aba, nitin, nureses run, etc
Below is the code, write it down yourself 😛
18. Take a random list and plot a histogram with 3 bins.
19. What is the different between range () and xrange () functions in Python? range () returns a list whereas xrange () returns an object that acts like an iterator for generating numbers on demand.
20. Guess the output of the following code x = “Fox ate the pizza” print(x[:7])
You can find Python interview questions on many websites, we will keep on updating this list. Time for some marketing, if you want to get some more interview questions on Python, then click below:-
Welcome to the world of Functions. This is undoubtedly the most important topic of your Data Science career 😛 Function will make your life easy and your peer’s life easier !!
Toh shuru karte hain, bina kisi bakchodi ke (Let’s start without wasting any time)
Defining a function A function is a block of code which runs only when it is called. Let’s start with defining a basic function:
Hello World program using a function
You can also define simple function to add two numbers and by passing values to the function
Simple function to sum two numbers
Information is passed in a function as a parameter. In the above example, x and y are two parameters. Arguments are the values passed to these parameters. 4 and 5 are the arguments of the function sum()
Using a default parameter – You might need a default parameter in case no value is passed to the function. It is done in the following way
Using both an argument and default parameter
Write a function to get the Maximum out of two number
You can also create a function without any name, it is called Lambda function. It is a small anonymous function which can take any number of arguments, but can have only one expression.
Let’s learn the basics of Lambda function. Below is the lambda function to add two numbers.
A lambda function to get the cube root of a number
Why do we need a Lambda function? Lambda function is a very convenient way to write small functions, but the real power of a Lambda function relies on the point that you can use it within a function. Let’s see how a lambda function can be used in a better way:-
Look at the above function hello. It has a parameter n which is passed as the string “Data”. This string is saved in x. Now if you pass a number to “x”, then it will be used as a and will multiply Data with 4 in this case.
When you don’t know the number of arguments to pass to a function, then you need to pass a variable parameter.
What *args allows you to do is take in more arguments than the number of formal arguments that you previously defined. With *args, any number of extra arguments can be tacked on to your current formal parameters (including zero extra arguments).
Below is how a variable parameter is passed to a pizza function.
Passing variable number of arguments in a pizza function
**kwargs You can use **kwargs to let your functions take an arbitrary number of keyword arguments (“kwargs” means “keyword arguments”)
The special syntax **kwargs in function definitions in python is used to pass a keyworded, variable-length argument list. One can think of the kwargs as being a dictionary that maps each keyword to the value that we pass alongside it. That is why when we iterate over the kwargs there doesn’t seem to be any order in which they were printed out.
A simple example of kwargs
Few questions which you should try from the previous exercises are:- 1. What is the difference between tuple and list? 2. How to store a dictionary in a list? 3. How to store a list in a dictionary? 4. Create a list using a loop and fill the list with square of numbers from 1 to 10. 5. Write a program to sum all the elements of the list.
You can either go through the previous days session or google these out. For more questions and answers like this, you can purchase our ebook from Amazon. Link below
Loop and functions are two most important topics in the basics of Python. You need to have a really good hand on loop and functions.
Loop is basically used to iterate the same thing again and again. Python, like most of the programming language, have two types of loop:- 1. while 2. for
While loop In a while loop, a condition is checked first and then the content or body of the loop is executed. A simple while loop is executed below
There are two more keywords which are used inside the body of a loop:- 1. break 2. continue
Break command is used to stop a loop at a particular condition and it pulls the control out of the loop. See the example below
Break statement stops the loop at the given condition
Continue statement is used to bypass a particular instance
Use of continue statement
2. For loop
A for loop is used for iterating over a sequence which could be anything like a list, a tuple, a dictionary or a set.
Let’s understand each with the help of some examples:
a. Applying loop on a list
b. Applying loop on a list with break statement
c. Using range keyword. Range starts with 0 and ends at n-1 where n is the parameter in the range() function
d. Using range keyword with increment
e. Nested loop
f. Looping through all the key-value pair of a dictionary
g. Looping through all the values of a dictionary
h. Looping through all the keys of a dictionary
i. Print the following pattern 1 22 333 4444
j. Reverse a list using loop
h. Reverse a string using loop, example to do it without loop is given below:
If you want to learn more about some tricky Python Questions then do check out our book on Amazon
One of the most important thing which you need to learn in Python is the use of conditional statement. These are small code snippets which will help you solve multiple problems in a project or any hackathon.
Conditional statements help us to apply a particular constraint on the data set. Suppose you want to pull the data only for a particular employee or user; or you want to filter the data for a particular date; or you want to count how many male and female are there in the given data set, every where you will be using these conditional statements.
Every programming language have almost the same conditional statement and Python is not an anomaly.
We will try to keep it crisp in this post but it will keep on haunting you in the upcoming posts, so, try to learn the basics here before proceeding.
There are three types of conditional statement used in Python: 1. if 2. else 3. elif
Python, like other programming languages, supports the usual logical conditions:
1. Equals: x == y 2. Not Equals : x != y 3. Greater than : x>y 4. Greater than or equal to : x >= y 5. Less than : x < y 6. Less than or equal to : x <= y
1. if is simple conditional operator where you put a condition and filter the data set or mould the data set in a particular manner.
P.S. – Python follows indentation religiously, so be very careful in writing codes
A simple example of if operator
2. else operator compliments the if operator. Suppose, the if condition is not satisfied, then the control will move to else
A simple if and else combo
3. elif helps in putting as many conditions in your program as you like. Look at the example below
A simple example of all the three conditional statements
Let’s try some more examples 1. Applying more than one condition using “and” keyword
2. Applying more than one condition using “or” operator
3. Applying condition on a list
4. Apply condition on a string
5. Multiple if statement
6. If the first “if” condition is true, then the conditional statements will break and even if the “else” condition is true, the control will not go to it. See the example below where both, if and else statements are true
7. if True condition
Summary of the day 1. You learned the basics of if, else and elif conditional statements 2. You can run multiple conditional statements in a nested query 3. You have practiced a few examples of using the conditional statement in different ways
If you have time, make a small calculator using everything you have learnt today
We know that you already know a lot about Python and it’s capability in the Data Science domain.
I have deliberately put screenshots so that you people have to type these commands to practice the syntax of Python 😛
To make sure everyone is on the same page, we will quickly go through the basics of Python:-
1. print(“Hello World”) – print() command to print anything
2. print(“Hello”+” World”) – Plus(+) operator to add two strings
3. Python will throw an error if you do not follow indentation in your code 4. In Python you do not have to declare any variable by a data type
5. There are three types of numeric types supported in Python:- a. int b. float c. complex
Use the type() command to know the data type
6. Multiple occasions will come when you have to type cast a variable into another data type. Python provides 3 functions for the same: a. int() b. float() c. str()
7. Some basic string operations:
8. Following are the operators used in Python: a. Arithmetic Operator – These include +,-,*,/,%,**(Exponential),//(Floor division) b. Assignment Operator – These include =,+=,-=, etc. c. Comparison Operator – These include >,<,<=,>=,!=,etc. d. Logical Operator – These include and, or, not. e. Identity Operator – These include is and is not operator f. Bitwise operator – These include &, |, ^, ~, << and >>
9. List is mutable and is a collection which is ordered and changeable. By mutable we mean that you can change the content of the List. A list can contain any data type.
Functions for List:- a. len() – To get the length of the list b. append() – To add an element to the end of a list c. insert() – To add an element at a desired position d. remove() – To remove specified element e. pop() – It removes the last index if nothing is specified f. del – The keyword del removes the specified index g. clear() – It empties the list
10. Tuples is an unchangeable and ordered collection. List uses a square bracket, whereas tuple uses round brackets. The value of the element of a tuple cannot be changed, thus it is called immutable.
You can completely delete the tuple, but can not add element or delete element from the tuple.
11. Set is another data structure in Python which is unordered and unindexed. Sets are defined by curly brackets.
You can add new items. To add one item you can use add() method, and to add multiple items you can use update() method.
len() function is used to get the length of the set remove() and discard() functions are used to remove an item from the set. Similarly you can use pop() to remove an item, clear() to empty the set, del to delete the set completely.
We can use the set() constructor to make a set
12. Dictionary is one of the most important and used data structure in Python. It stores the values in key-value pair. It is changeable, unordered and indexed.
The first element is called key and the second is the value. If you have the same key for two different values then it will not get printed. Refer to the example below:
Three important ways to access an element in a dictionary are:- 1. for x, y in name.items(): print(x, y)
2. for x in name.values(): print(x)
3. for x in name: print(x)
Keep creating tuple, dictionary, and set for the rest of your life 🙂
5-6 years back Java was said to be ever lasting. Everyone wanted a Java developer in their team. Looking at the current scenario, we can safely assume that Python is and will be one of the most used Programming language across multiple domains ranging from software development to web development and Data Science.
Talking particularly about Data Science, Python is blessed by a humongous community of Data Scientists who contribute a lot to the development and betterment of the language. Apart from the community, the libraries and packages which are regularly developed are making it easier for people to explore Data Science.
Python is not the only language which can be used for Data Science purpose. Few other languages are:- 1. R 2. SAS 3. JAVA 4. C
We will try to cover everything in Python so that you get fluent in at least one language and in the current era if you have to choose one language to better your career, then do give a shot to Python.
Python
At the time of writing this blog, two versions of Python are popular Python 2.7 Python 3.*
Download Start with downloading Anaconda Once you have Anaconda in your system, execute it. It will take ~10 mins to get it done.
From the start itself, try to use Jupyter notebook for your Python programming.
How to launch Jupyter Notebook? Once you have installed Anaconda, you will get an Anaconda Navigator in your start menu or on your desktop. Double click to open it.
This is how Anaconda Navigator will look like. Click on the Launch button below the Jupyter Notebook ico
The Jupyter notebook will look something like the one below:
Jupyter Notebook home screen
Click on the new button and select Python 3(if Python 3 has been installed)
Running your first Python program
A programmer is not a programmer is he does not start a new language with Hello World and I ain’t a programmer no more, so I will start with printing The Data Monk 😛
Write the below simple code:
print(“The Data Monk”) and press Shift+Enter to run the line of code. The output will be shown just below the code.
Printing The Data Monk as the first task
In the next few days, we will import a lot of libraries, try out some good algorithms and visualizations, and will solve some case studies.
You can also install R or any other language and search for the implementation of the algorithms and make cool visualizations 🙂
Few of the libraries which will come handy in this journey are:- 1. NumPy 2. sciPy 3. Matplotlib 4. Pandas
If you have already installed everything, then hop on to Day 21.
1.Whatis a population and a sample? Population is the complete targeted group of people/objects on which the analysis needs to be performed. If the target is Mumbai population then the population will be the total number of people living in Mumbai.
2. What is a sample? A sample is like a subset of the population. Most of the times you won’t be able to do your complete analysis on the Population data set as there will be hundreds of millions of rows and processing it will consume a lot of time. So, we take a sample of data which should be random and unbiased from the population.
3. What is a nominal data set? Nominal data is recorded as categories in a data set. For example, rocks can be generally categorized as igneous, sedimentary and metamorphic.
4. What are the types of variables? Discrete Variable – A variable with a limited number of values (e.g., gender (male/female), college class (freshman/sophomore/junior/senior) Continuous Variable – A variable that can take on many different values, in theory, any value between the lowest and highest points on the measurement scale. Independent Variable – A variable that is manipulated, measured, or selected by the researcher as an antecedent condition to an observed behavior. In a hypothesized cause-and-effect relationship, the independent variable is the cause and the dependent variable is the outcome or effect. Dependent Variable – A variable that is not under the experimenter’s control — the data. It is the variable that is observed and measured in response to the independent variable. Qualitative Variable – A variable based on categorical data. Quantitative Variable – A variable based on quantitative data.
In general, statistics is a study of data: describing properties of the data, which is called descriptive statistics and drawing conclusions about a population of interest from information extracted from a sample, which is called inferential statistics.
5. What are the types of measurements in statistics? 1. Measures of Center –Mean, Median and Mode 2. Measure of Spread –Variance, Standard Deviation, Range and Inter Quartile Range 3. Measures of Shape –Symmetric, Skewness, Kurtosis
6. Define mean. The mean is the most common measure of central tendency and the one that can be mathematically manipulated. It is defined as the average of a distribution is equal to the SX / N. Simply, the mean is computed by summing all the scores in the distribution (SX) and dividing that sum by the total number of scores (N). Example: Heights of five people: 5 feet 6 inches, 5 feet 7 inches, 5 feet 10 inches, 5 feet 8 inches, 5 feet 8 inches. The sum is: 339 inches. Divide 339 by 5 people = 67.8 inches or 5 feet 7.8 inches. The mean (average) is 5 feet 7.8 inches.
7. Give an example of a median. Find the median of 5 feet 6 inches, 5 feet 7 inches, 5 feet 10 inches, 5 feet 8 inches, 5 feet 8 inches. Line up your numbers from smallest to largest: 5 feet 6 inches, 5 feet 7 inches, 5 feet 8 inches, 5 feet 8 inches, 5 feet 10 inches. The median is: 5 feet 8 inches (the number in the middle). Even amount of numbers: Find the median of 7, 2, 43, 16, 11, 5 Line up your numbers in order: 2, 5, 7, 11, 16, 43 Add the 2 middle numbers and divide by 2: 7 + 11 = 18 ÷ 2 = 9 The median is 9.
8. Give an example of mode. Example: Height Chart with people lined up in order of height, short to tall. Find the mode of 5 feet 6 inches, 5 feet 7 inches, 5 feet 10 inches, 5 feet 8 inches, 5 feet 8 inches. Put the numbers is order to make it easier to visualize: 5 feet 6 inches, 5 feet 7 inches, 5 feet 8 inches, 5 feet 8 inches, 5 feet 10 inches. The mode is 5 feet 8 inches (it occurs the most, at 2 times).
9. What is IQR? The interquartile range is a measure of where the “middle fifty” is in a data set. Where a range is a measure of where the beginning and end are in a set, an interquartile range is a measure of where the bulk of the values lie. That’s why it’s preferred over many other measures of spread (i.e. the average or median) when reporting things like school performance or SAT scores.
10. How to calculate IQR? Step 1: Put the numbers in order. 1, 2, 5, 6, 7, 9, 12, 15, 18, 19, 27.
Step 3: Place parentheses around the numbers above and
below the median.
Not necessary statistically, but it makes Q1 and Q3 easier to spot.
(1, 2, 5, 6, 7), 9, (12, 15, 18, 19, 27).
Step 4: Find Q1 and Q3
Think of Q1 as a median in the lower half of the data and think of Q3 as a
median for the upper half of data.
(1, 2, 5, 6, 7), 9, ( 12, 15, 18, 19,
27). Q1 = 5 and Q3 = 18.
Step 5: Subtract Q1 from Q3 to find the interquartile
range.
18 – 5 = 13.
11. Define the measure of shape. Measure of Shape
For
distributions summarizing data from continuous measurement scales, shape of
graph can be used to describe how the distribution rises and drops.
Symmetric – Distributions that have the same shape on both sides of
the center are called symmetric. A
symmetric distribution with only one peak is referred to as a normal
distribution.
Skewness – Skewness is a measure of the asymmetry
of the probability distribution of a real-valued random variable about its
mean. The skewness value can be positive or negative, or even undefined. The
qualitative interpretation of the skew is complicated and unintuitive.
12. What is positive skeweness and negative skewness? Positively skewed – A distribution is positively skewed when is has a tail extending out to the right (larger numbers) When a distribution is positively skewed, the mean is greater than the median reflecting the fact that the mean is sensitive to each score in the distribution and is subject to large shifts when the sample is small and contains extreme scores.
Negatively skewed – A negatively skwed distribution has an extended tail pointing to the left (smaller numbers) and reflects bunching of numbers in the upper part of the distribution with fewer scores at the lower end of the measurement scale.
The formula to find skewness manually is this: skewness = (3 * (mean – median)) / standard deviation
13. What is the correlation? Correlation is one of the most basic and important concepts in data science. In a layman language, it is used to get the degree of relationship between 2 variables.
For example – Height and Weight are related i.e. taller people are generally heavier than the shorter one. But, the correlation between these might not be perfect. Consider the variables family income and family expenditure. It is well known that income and expenditure increase or decrease together. Thus they are related in the sense that change in any one variable is accompanied by the change in the other variable.
Correlation can tell you something about the relationship between variables. It is used to understand: 1. Whether the relationship is positive or negative 2. The strength of the relationship.
Correlation is a powerful tool that provides these vital pieces of information.
In the case of family income and family expenditure, it is easy to see that they both rise or fall together in the same direction. This is called a positive correlation.
14. What are the two types of regression? There are two types of regression analysis:- 1. Linear Regression Analysis 2. Multiple Regression Analysis
15. What is Linear Regression? Starting with Linear Regression Analysis, It is basically a technique used to determine/predict the unknown value of a variable by looking at the known values. If X and Y are two variables which are related, then linear regression helps you to predict the value of Y.
A simple example can be the relationship between age of a person and his maturity level. So we can say that these 2 are related and we can guess the maturity level of the person.
By linear regression, we mean models with just one independent and one dependent variable. The variable whose value is to be predicted is known as the dependent variable and the one whose known value is used for prediction is known as the independent variable.
Y = a + bX
This is the linear regression of Y on X where a and b are unknown constant and slope of the equation.
Choice of linear regression is one of the most important parts of applying it. For example, suppose you want to have 2 variables, crop yield (Y) and rainfall (X). Here the construction of the regression line of Y on X would make sense and would be able to demonstrate the dependence of crop yield on rainfall. We would then be able to estimate crop yield given rainfall.
Careless use of linear regression analysis could mean construction of regression line of X on Y which would demonstrate the laughable scenario that rainfall is dependent on crop yield; this would suggest that if you grow really big crops you will be guaranteed a heavy rainfall.
If the regression coefficient of Y on X is 0.53 units, it would indicate that Y will increase by 0.53 if X increased by 1 unit. A similar interpretation can be given for the regression coefficient of X on Y.
16. What is multiple linear regression?
As the name suggests, multiple linear regression uses 2 or more variables as a predictor to get the value of the unknown variable.
For example, the yield of rice per acre depends upon the quality of seed, the fertility of soil, fertilizer used, temperature, rainfall. If one is interested to study the joint effect of all these variables on rice yield, one can use this technique.
An additional advantage of this technique is it also enables us to study the individual influence of these variables on yield.
Y = b0 + b1 X1 + b2 X2 + …………………… + bk Xk
Here b0 is the intercept and b1,b2,b3, etc. are analogous to the slope in the linear regression.
You need to know whether your regression is good or not. In order to judge your regression model examine the coefficient of determination(R2) which always lies between 0 and 1. The closer the value of R2 to 1, the better is the model.
A related question is whether the independent variables individually influence the dependent variable significantly. Statistically, it is equivalent to testing the null hypothesis that the relevant regression coefficient is zero.
This can be done using t-test. If the t-test of a regression coefficient is significant, it indicates that the variable is in question influences Y significantly while controlling for other independent explanatory variables.
17. What are the major differencws between Linear and Multi linear regression? In simple linear regression a single independent variable is used to predict the value of a dependent variable. In multiple linear regression two or more independent variables are used to predict the value of a dependent variable. The difference between the two is the number of independent variables.
As an example, let’s say that the test score of a student in an exam will be dependent on various factors like his focus while attending the class, his intake of food before the exam and the amount of sleep he gets before the exam. Using this test one can estimate the appropriate relationship among these factors.
18. What is Logistic Regression? Logistic regression is a class of regression where the independent variable is used to predict the dependent variable. When the dependent variable has two categories, then it is a binary logistic regression. When the dependent variable has more than two categories, then it is a multinomial logistic regression. When the dependent variable category is to be ranked, then it is an ordinal logistic regression (OLS). To obtain the maximum likelihood estimation, transform the dependent variable in the logit function. Logit is basically a natural log of the dependent variable and tells whether or not the event will occur. Ordinal logistic regression does not assume a linear relationship between the dependent and independent variable. It does not assume homoscedasticity. Wald statistics tests the significance of the individual independent variable.
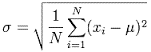
19. Can Standard Deviation be False? The formula for standard deviation is given below
Since the differences are squared, added and then rooted, negative standard deviations are not possible.
20.What is p-value and give an example? In statistical significance testing, the p-value is the probability of obtaining a test statistic at least as extreme as the one that was actually observed, assuming that the null hypothesis is true. If the p-value is less than 0.05 or 0.01, corresponding respectively to a 5% or 1% chance of rejecting the null hypothesis when it is true (Type I error). Example: Suppose that the experimental results show the coin turning up heads 14 times out of 20 total flips * null hypothesis (H0): fair coin; * observation O: 14 heads out of 20 flips; and * p-value of observation O given H0 = Prob(≥ 14 heads or ≥ 14 tails) = 0.115. The calculated p-value exceeds 0.05, so the observation is consistent with the null hypothesis — that the observed result of 14 heads out of 20 flips can be ascribed to chance alone — as it falls within the range of what would happen 95% of the time were this in fact the case. In our example, we fail to reject the null hypothesis at the 5% level. Although the coin did not fall evenly, the deviation from expected outcome is small enough to be reported as being “not statistically significant at the 5% level”. <sites.google.com>
Questions from Statistics are mostly around the following topics:- 1. Regression 2. Tests in Statistics 3. Hypothesis testing 4. Mean, Median, and Mode 5. Correlation, Standard Deviation, and Variance
This page will be updated every few days. Keep checking the page.
Hypothesis testing is one of the most important topic in a Data Science course. Hypothesis tests evaluates two mutually exclusive statements about a population to decide which one is the best suited by the help of sample data. There are a lots of test in statistics and we will target the important tests which you might have to do in a day-to-day Data Science life. We will also try to keep everything aligned to Python.
Here are the top 8 tests in statistics:- 1. Chi-Squared test 2. Student’s T-test 3. Analysis of Variance Test (ANOVA) 4. Pearson’s Correlation Coefficient 5. Kruskal-Wallis Test 6. Z-Test 7. Spearman’s Correlation Test 8. Wilcoxon’s Stratified Test
Why is hypothesis testing one of the most confusing and sometimes irritating things to learn? Well this is mostly because there are a lot of parameters which you need to consider while testing something. You can’t just run a Chi-Squared test or Z or T test wherever you want. You have to keep the sample size in mind, you might have to look for some variables which might or might not be favorable to a particular test, etc.
We will try to keep things simple. You need to understand the things working in the background and what actually can you derive from a test result.
This session is quite quite important for us, for you, and for anyone who wants to make a career in data science.
What is hypothesis? There are lots of definition floating on the internet, but you need to understand the actual meaning of hypothesis. A hypothesis is a claim. Suppose you are saying that the average age of people working in Aviator building is 26. Now you can not go and ask everyone about their age. But what you can do, is that you can pick a sample i.e. a group of people(unbiased obviously) and get their data. Now your data says that the average age is 28. This is the claim from the sample and now you have to test this claim to see if it’s actually true.
The second most irritating question is, What is a null hypothesis? Null Hypothesis is fairly simple to understand using example. Don’t hog the definition. Null hypothesis is something which we want to disprove. In the above caseNull hypothesis could be “The average age of people working in Aviator building is 26”
Null hypothesis takes up a current situation, if you want to challenge the null hypothesis, then you need to come up with an alternate hypothesis, something like this – “I am not sure if the average age is 26 because I feel nowadays experienced and laterals are hired too much. So, I will challenge the Null hypothesis”
Null Hypothesis – Average age is 26 Alternate Hypothesis – Things have chanegd and the average age is not 26. Let’s test and find the truth
How to write these down:- Ho(H-knot) : Mean = 26Years Ha(Alternate Hypothesis) : Mean != 26Years
Null and Alternative hypothesis is the mathematical opposite of each other.
Whenever you test something in statistics, there are only two possible outcomes:- 1. Reject the null hypothesis and confirms that the average age is anything but 26 2. Fail to reject the null hypothesis after all the tests and confirms that the average age is 26
Why can’t we directly prove that the average age is 26? The Monk once said “If you can’t reject it, it means you accept it. It’s very hard to prove that you are true, so in order to prove that you are true, you need to prove that you are not false”. Thus we try to play around proving or disproving the “rejection of null hypothesis” and not proving the already proved Null hypothesis.
For example – If you want to prove that a beggar is actually poor. How will you proceed? Your null hypothesis here will be that the beggar is poor. Your alternate hypothesis will be that the beggar is not poor and you can prove it by showing his mobile bill or the latest iPhone he bought or his Blood red BMW parked right reside he begs. Prove at least one thing to disprove the already accepted fact that he is poor
Now, you take a sample of 100 employees and ask their age. You get an average age. But how to make sure that this sample represents the complete population? We use test statistics to answer the below point :
If the data you have is statistically significant enough to reject the null hypothesis.
Let’s continue with the same example. We took 5 people and sent them to different floors of the building asking 100 employees on each floor about their age. Below is the result accumulated by the 5 people about the average age: 1. Amit – 26.2 Years – Close enough to our Null hypothesis 2. Sahil – 27 Years – A bit far 3. Aman – 28 Years- Way far 4. Harish – 27.3 Years – Quite far 5. Rishabh – 29 Years- Very far
See, you got the result and you can say that everything is suggesting that the Null hypothesis is false, but we can’t use terms like far, very far, very very far to prove these things. There should be somthing very concrete, both mathematically and logically to come to a conclusion. Basically, we want to know the boundry line condition which will confirm that if the age is more than 26.3Years (sample) then we can reject the null hypothesis i.e. till what point can we accept or reject something.
You can’t directly reject a Null hypothesis if the average age of 50 people is 26.1 and your Null hypothesis is 26 😛
We need to check the confidence of your hypothesis, and here comes the term “level of confidence”
I am saying that I am 99% confident that I will pass the exam, that means you can trust me. If I say I am 63% confident on passing the exam, then that is a low confidence and I might not believe you.
In statistics, we mostly use 90%,95%, and 99% confidence interval i.e. 0.90,0.95, and 0.99
Level of significance(Alpha) = 1 – c where c denotes a level of confidence and it falls in the range of 0 to 1
1. Chi-Square Test A chi-square test helps in determining whether there is a significant difference between the observed and calculated frequencies in one or more categories.
Actual is the observed frequency and expected is the frequency that should be there to show that there is no significant difference
In order to calculate the expected value, do the following:- (Column Total*Row Total)/Grand Total Ex. (25*60)/100 = 15 (25*40)/100 = 10
Now you have both actual and expected value. To get the chi square value you need the following formula
Now calculate the same for all the 4 cells. You will get – 2.0 as the value of chi-square
To know the significance of the number, you also need to know one more term i.e. Degree of Freedom The simple formula of degree of freedom here is = (No. of columns – 1) * (No. of rows – 1)
Here the degree of freedom is 1 and the value of chi-square is 2.0. Have a look on the critical value of chi-square with respect to degree of freedom table
As we can see, for DoF 1, the critical value is 3.841 and we got 2.0. This means that the Null Hypothesis is true and gender has not much effect on the preferred color.
See, this is a very simple way of understanding Chi-Square test. The more you explore, the better you understand.
Data Science is 60% Mathematics and 40% coding and other things. Obviously, the numbers are random, but it makes complete sense. You need to defend your analysis with statistics. On a serious note, your honeymoon period is over. The statistics material will require more concentration and we will try to make sure that you understand each concept inside out, but if you are unable to grasp something, feel free to comment or google about it. There is an ample amount of good resource on the internet. Try those out as well. We will also post some useful links wherever required to help you understand things better.
Statistics has a very basic and effective definition
“It is a science of collection, analysis, interpretation, presentation, and organization of data to help in making EFFECTIVE DECISION”
Suppose you sell books online on Kindle(much like TheDataMonk), so you will have a set of customers who would have bought your book, you know their email id. Now one day you decide to run a campaign to send emails to those customers or maybe some coupon codes with discount. You can’t send a coupon to everyone, so you will decide on selecting a group of customers for this campaign. Now you need to know the effectiveness of this campaign, here you need to know statistics with your organized data to make a better decision in the future.
One more example – You told your client that you will be using a particular algorithm for a problem. You already know that you are receiving a good result with this algorithm, but then also you need to prove the same to the Client. In this situation, statistics will come to your rescue.
Basically, there are two types of statistics:- 1. Descriptive Statistics – It is a method of organizing, summarizing, and presenting data. If you are answering questions like below, then its a part of descriptive statistics:- a. How many SQL books were sold? b. How many unique visitors come to the website daily? c. How many pages of the books were read on Kindle? d. What value is the middle of the range of revenue from Kindle?
Graphical representation also comes in Descriptive statistics. The use of histogram, pie charts, etc. are used in descriptive analysis.
2. Inferential Statistics – When you will search the meaning of the word “inferential”, this is what comes up
It basically means that this part of statistics deals with creating inference out of a sample and then applies it on the population. Population is the total number of data points in an analysis and Sample is the selected number of data points which are randomly picked from the population.
Example – You office has a capacity of 10000 employees and you need to know the average age of the office. In this case you will not ask each one of them, instead you will take a random sample of may be 2000 employees and will consider the average of this sample to be the average age of the office.
Some of the basic statistical terms are given below:- 1. Experiement – It is a planned activity which is carried out on a sample to get a result. 2. Parameter – A numerical value which summarizes in the entire population 3. Variable – A characteristic of each individual item in a population. Example- salary, age, experience, etc. of an employee 4. Statistics – Summary of the sample data 5. Data – A value associated with one element of a population
If we consider our book selling website, we can assume that variables here are – a. Number of people reading book online b. Number of people buying book online c. Number of people putting it in the cart but not buying
The above are the examples of a variable.
Now, if I say we sell around 30 books per day, then that’s a data. The campaign which we discussed is an experiment. A parameter is something which summarizes a data, what is the average number of unique visitor on the website www.thedatamonk.com? What is the average number of time spent on the website by a visitor? These parameters take the complete data point into consideration.
Now, try to understand the term statistics. You work in a 14-floor building and you need to know the average age of the office. You take 50 employees from each floor and get the average age. Inferential statistics suggests that it is the average age of the population based on your sample. Statistics is the mean, median, variance, etc. of this sample alone.
Variable is one of the most important terms used in statistics. Variable is of two types:- a. Quantitative -> Measurable. Example – Time spent by a user on the website. We can divide the measurable quantity in two parts:- 1. Discrete – These are natural numbers like Number of users visiting a website, number of cars owned by a businessman 2. Continuous – These are real numbers like the weight of a person (88.3 Kg), the power of a lens, etc. b. Qualitative -> Non-measurable. Example – Visitors from which country is better for the website. We can divide the non-measurable quantity in two parts:- 1. Nominal – If you ask a sample their favorite color and you get three responses – Red, Green, and Black. You further replace these colors with the number like 1,2, and 3. But, you can’t say that 3 is better than 1 or more than 1. 2. Ordinal – Zomato delivery person brings your food and you rate him 5, next day a different person delivers you and you rate him 2. It does mean that the first guy was better but it does not mean that the first one was 2.5 times better than the second delivery boy
Measure of Central Tendency
When you start exploring data, you will always need something which can define your complete dataset. There are three measures in statistics which is used to summarize a dataset:-
1. Mean – You already know that mean is nothing but the average of the complete dataset. It is also one of the most used term in the world of statistics.
2. Median – You arrange the numbers in an increasing or decreasing order and pick the middle term if the total term is odd, calculate the avergae of the two middle terms if the total term is even. This will give you median of a dataset.
3. Mode – There are 100 students and they scored in the range 40 to 90. There were 40 students who scored exactly 45 which is the maximum number of students scoring the same marks. 45 will be the Mode of the dataset.
It’s easy to understand the meaning of mean, median, and mode. But there are two questions which need to be answered:- 1. When to use mean, median, and mode? 2. Is there a relationship between these three terms?
Let’s start with the second question, yes there is a rough relationship between the three terms:-
Mean – Median = 3(Mean-Mode)
Mean gives you the average of a dataset, so if you want to ask what will be the bill of the customer coming next in your restaurant, so can safely use mean of all the bills.
Suppose you are working in a startup and you need to know the salary of the average employee. The salary of a peon and CEO will bias the mean, thus you can’t use mean. Median removes the outlier from both the sides(lower and higher) and presents a better picture of the dataset.
When you are in a class, distributing answer sheet with marks to the students. Till now, 60% of the students scored 80 marks, so we can say that the Mode is 80 and there is a high chance that the next person will get 80 as well.
Use Mean when your data is not biased or when the sample is huge. Use Median when your data could be biased or the sample is small. USe Mode when you need to say the expected value of the upcoming data point.
One interesting example We found on Quora was that if a lottery costs you 1 dollar then the mean of return will be ~60 cents because of the heavy prize money. But the median and mode, both will be zero which is true also considering the very low chance of winning a lottery.
Next we will go through the Measure of Dispersion.
Measure of dispersion shows how variable the data is i.e. how spread out the distribution is. There are two measures of dispersion:- 1. Range – Difference between the maximum and the minimum value 2. Variance and Standard Deviation
You should definitely know how to calculate some of the basic terms manually. While coding you will have in-built functions in every language, but it’s good to know the actual meaning of these building blocks of statistics.
Variance is the arithmetic mean of the squared deviation from the mean. This is a very standard definition. We will try to break this down to make it easier to understand and remember.
Take 5 numbers – 1,2,3,4,5 What is the mean? 15/5 = 3 SQUARED DEVIATION from the mean means (1-3)(1-3), (2-3)(2-3), (3-3)(3-3),(4-3)(4-3),(5-3)(5-3)
Now you have to take the mean of the number above to compute the variance. One small catch, you will have to divide it with N-1. You don’t just have to learn the formula, but to understand the reason behind it.
In a population variance formula, you will divide the above calculation with N, whereas in a sample variance formula you will divide it by N-1. Below is the reason why?
A sample mean is not the same as the population mean because it’s not necessary to have the same values in the sample as in the population.
Let’s add one more term and make it more confusing 😛
Degree of Freedom – The degree of freedom for a calculation is the number of values in the final calculation of a statistics/parameter that are free to vary.
Suppose there is a dataset with 1000 numbers and the mean of the complete population is 10. Now you select a sample from the population:-
10,12,8,9,12 – The mean here is 10.2. This is understandable as the sample is not a replica of the population but just a mere representation of the population. Calculating the Squared Deviation from Mean will be
= (10-10.2)(10-10.2)+(12-10.2)(12-10.2)… = 12.8
Whereas when we use the population mean instead of the sample mean, we get the following value:- =(10-10)(10-10)+(12-10)(12-10).. = 13
Using sample mean will always lead to downward bias of the value. To counter this, we use N-1 instead of N in the sample variance formula. Thus the downward bias is somewhat fixed.
Why is it downward biased? The sample mean is closely associated with the values given in the sample whereas the population mean is away from the sample mean.
We can also understand why we are using N-1 instead of N by understanding the concept of Degree of Freedom in both Sample and Population variance.
Suppose you have 4 values and you know the mean of the following value, then how many numbers do you need to find out to complete the set of 4 numbers. Example – The numbers are 1,2,y and x and the mean is 8, Here you just need to know the value of either x or y to find out the complete dataset.
Since the sample is a variable, so each time we need to know N-1 values to know all the N values in the sample. It can not happen with the population variance since all the values are fixed.
Basically, N-1 is used to remove biasness from the dataset in a sample variance. We use N when calculating the population variance because there are no biasness.
Standard Deviation is nothing but the square root of the variance
Mu is the Population Mean A bar on X is used to demote Sample Mean
Population Variance is denoted by Sigma square Sample Variance is denoted by S square
Population Standard Deviation is denoted by Sigma Variance Standard Deviation is denoted by S
Try to grasp the basics and then only move forward.